Screenshots Gallery
This page showcases all the screenshots from the Django Observability Stack. Use the tabs below to browse by category.
📊 Grafana Dashboards
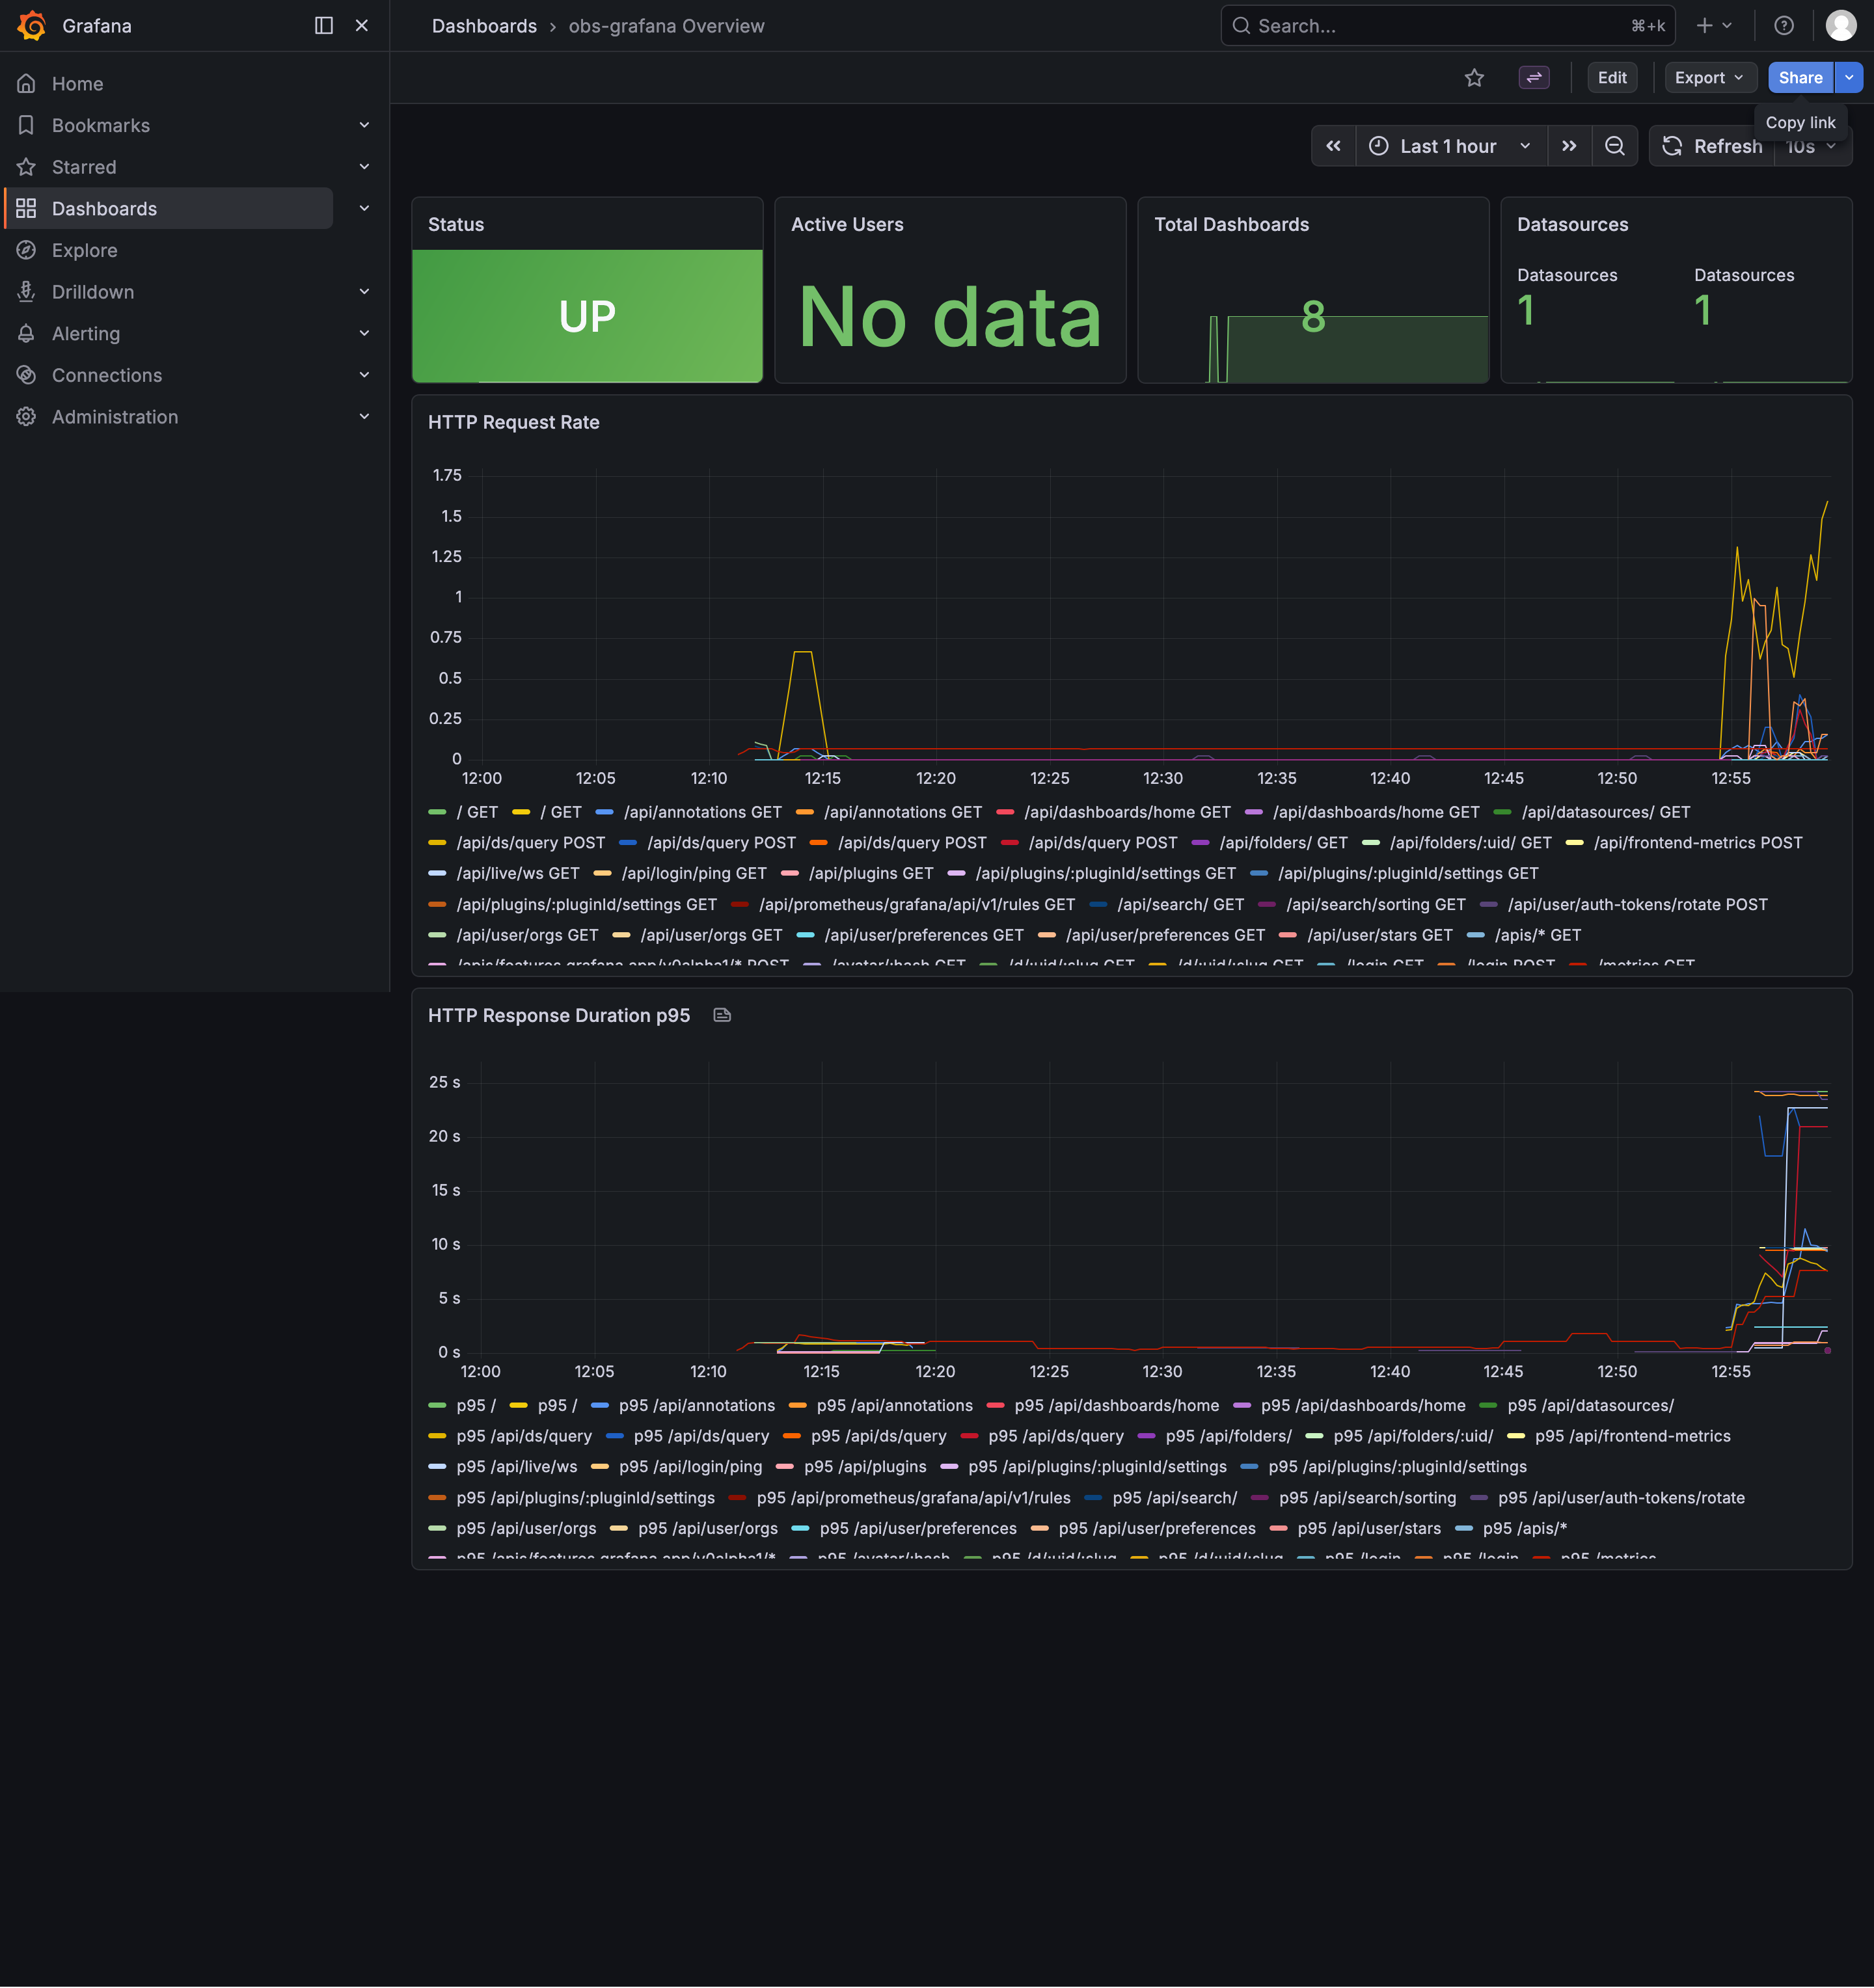
Main Dashboard - Overview of all services and metrics
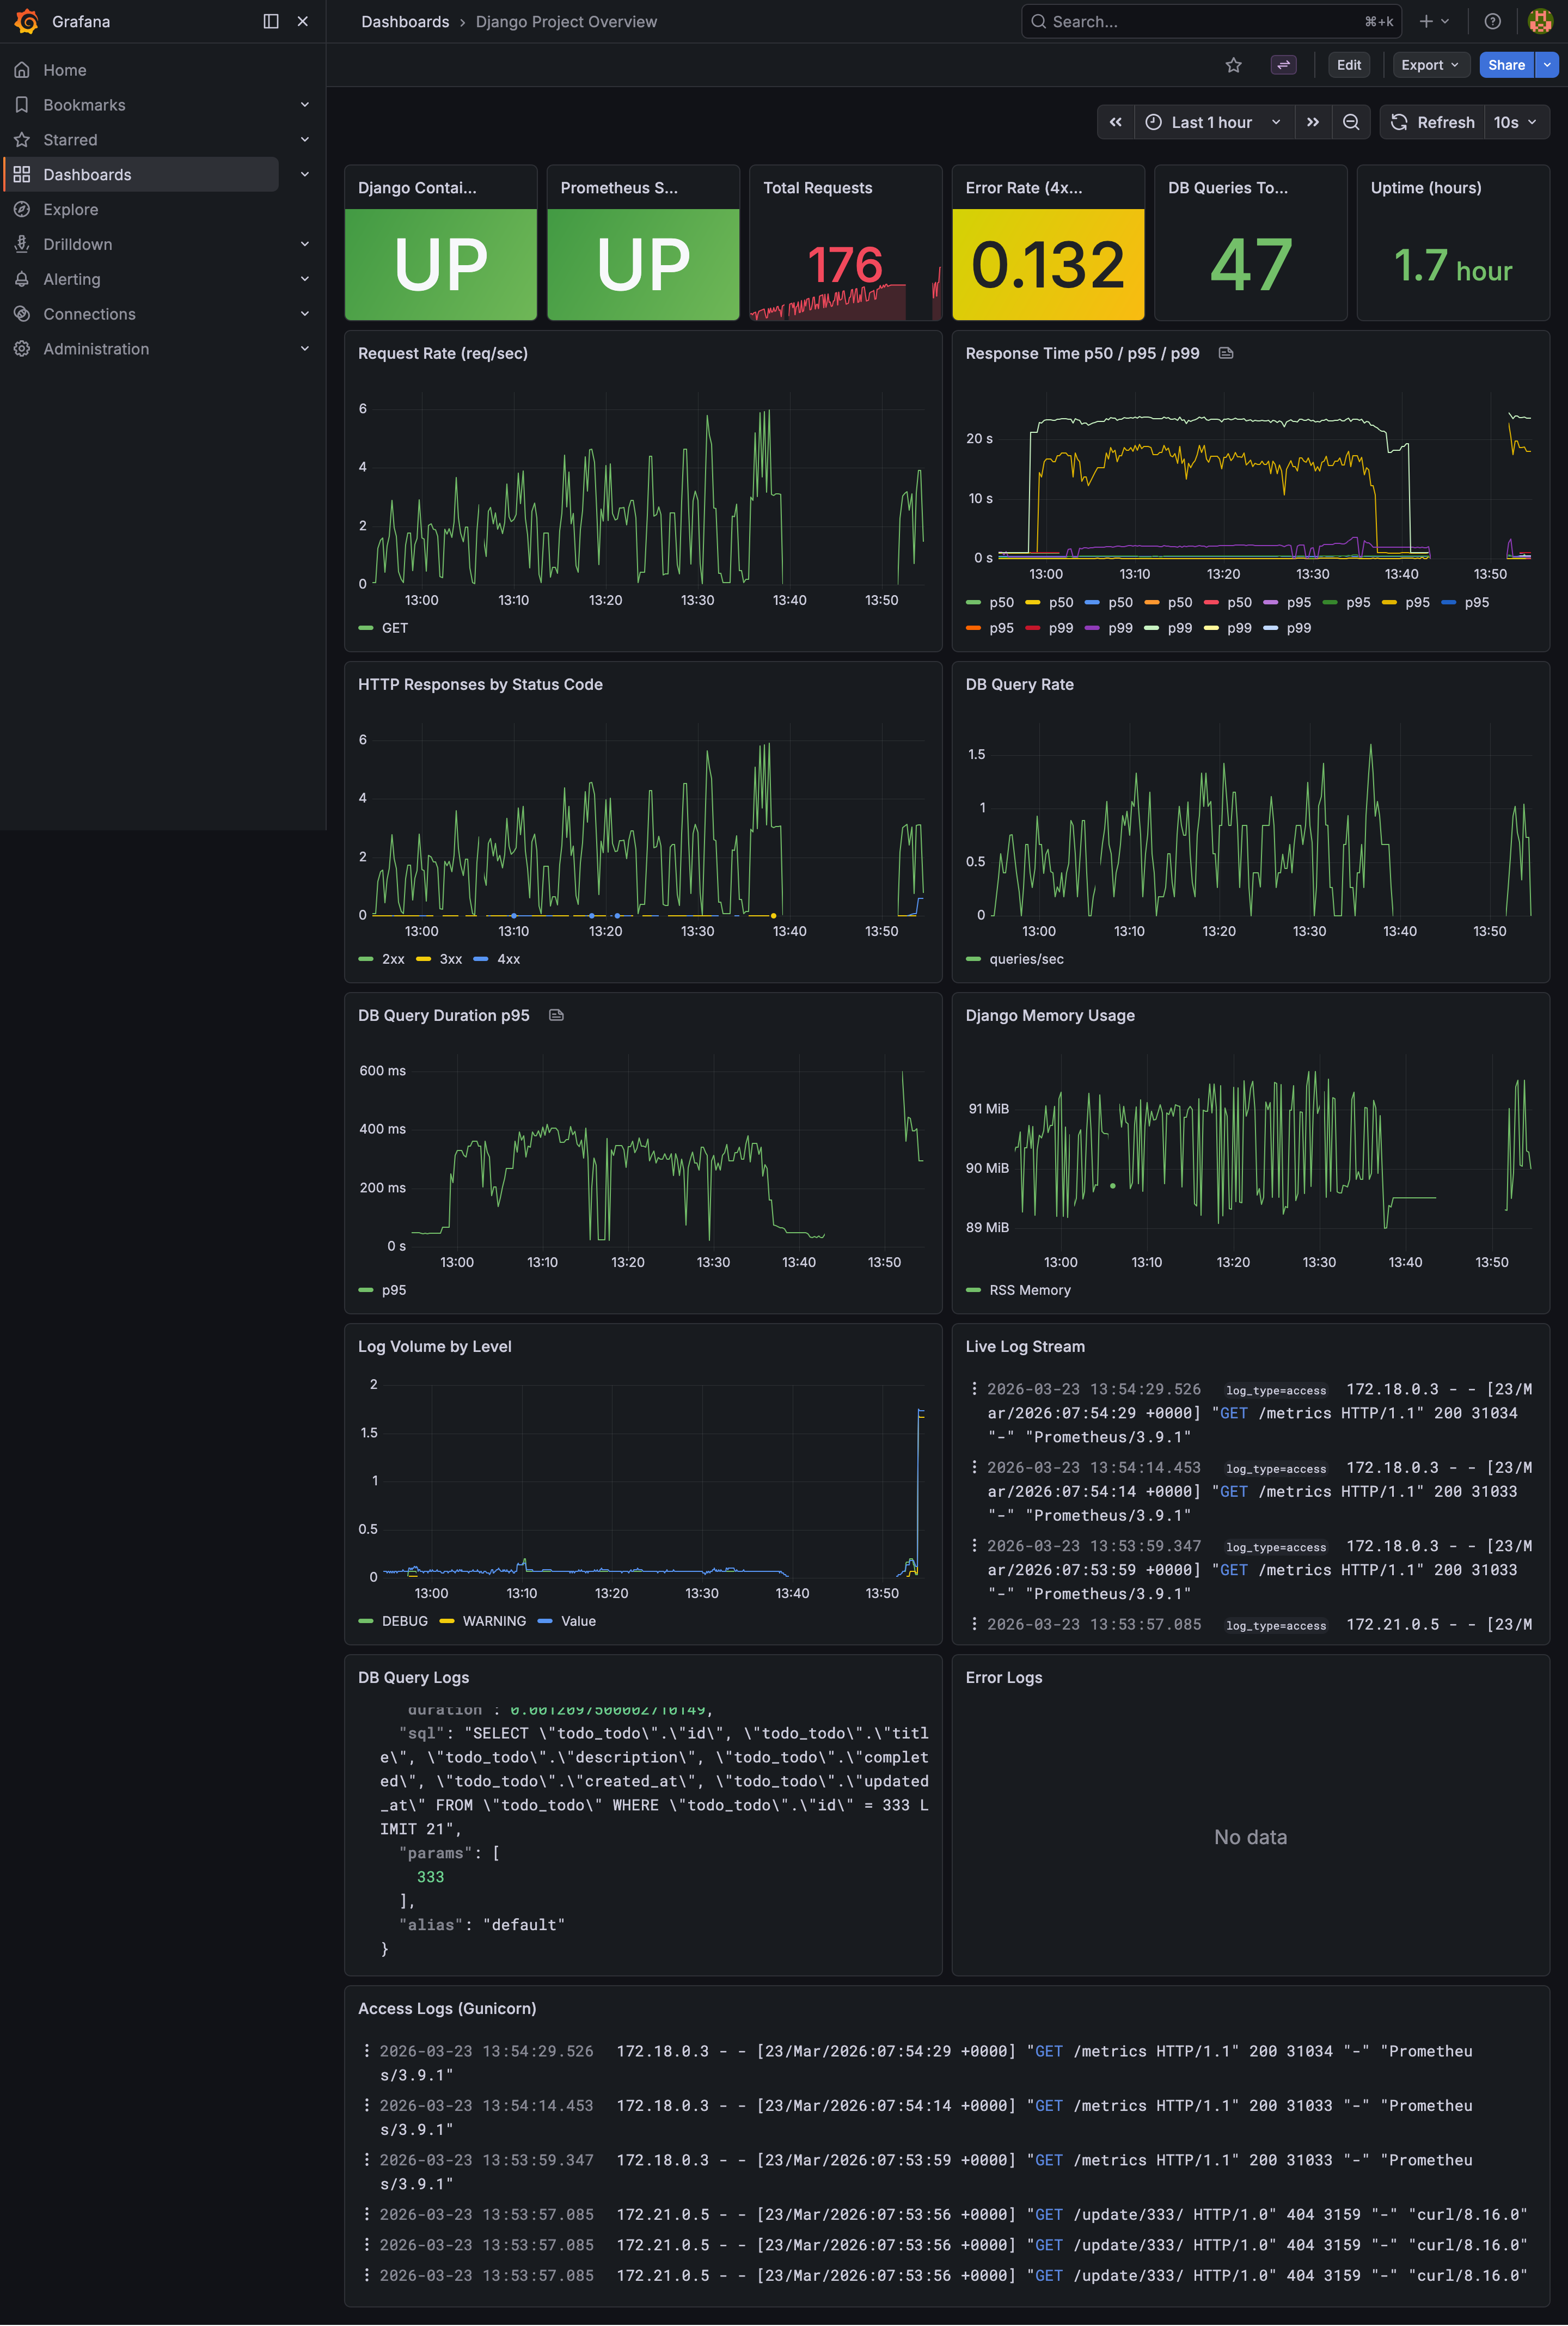
Django Dashboard - HTTP requests, latency, and errors
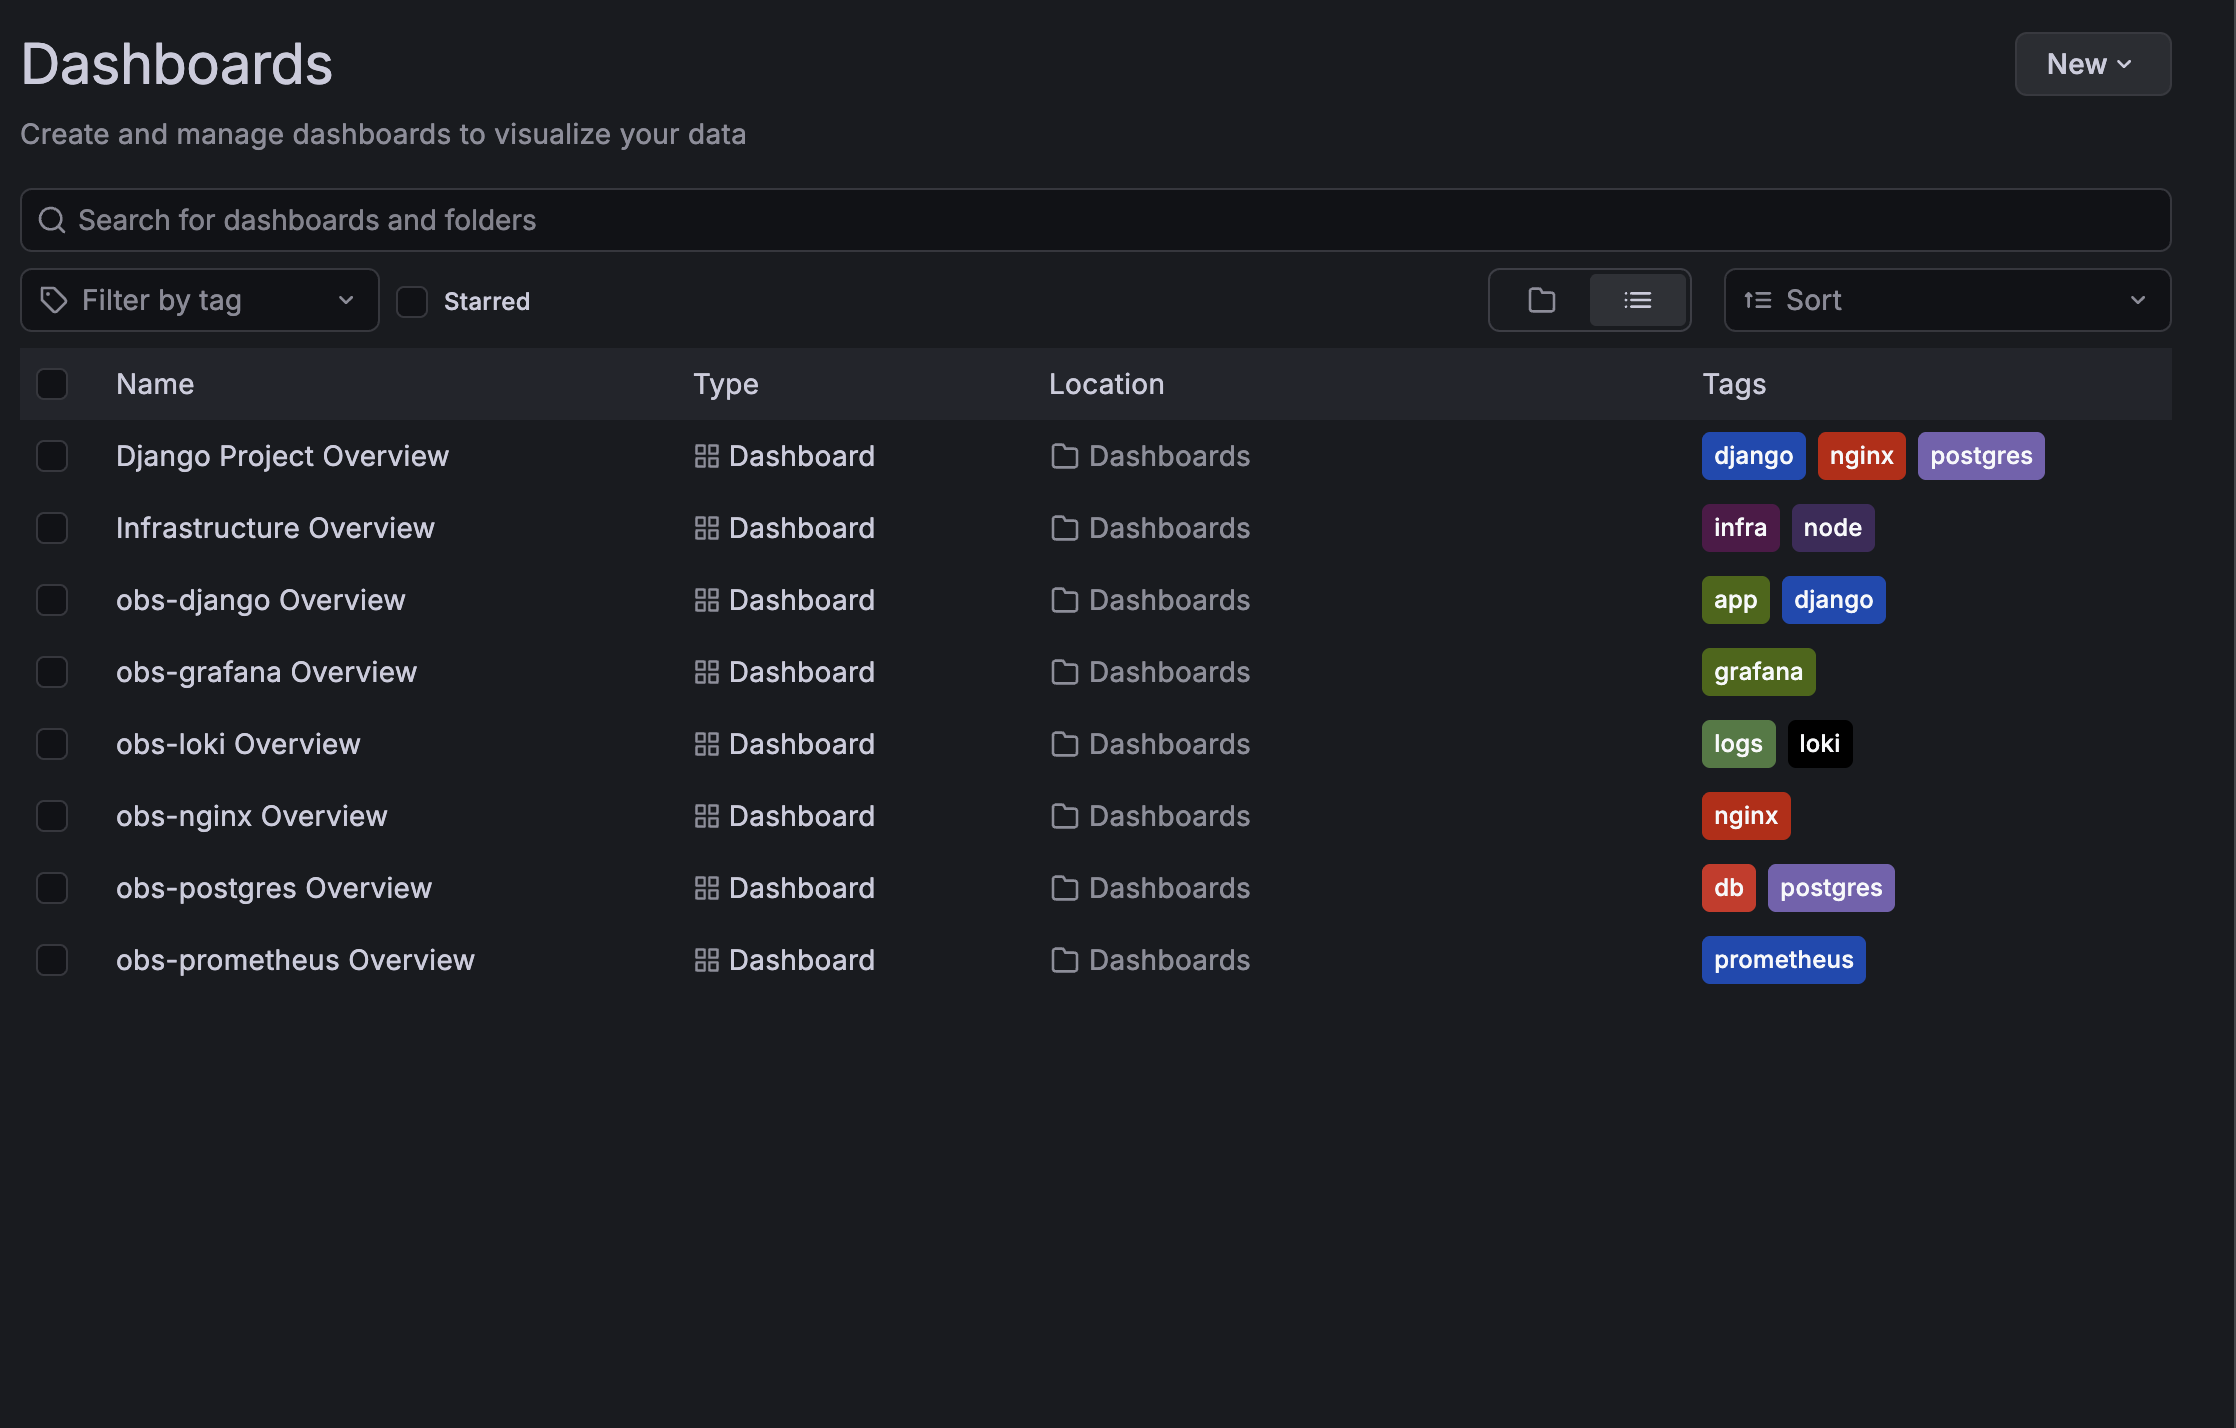
Detailed View - Custom Grafana dashboard configuration
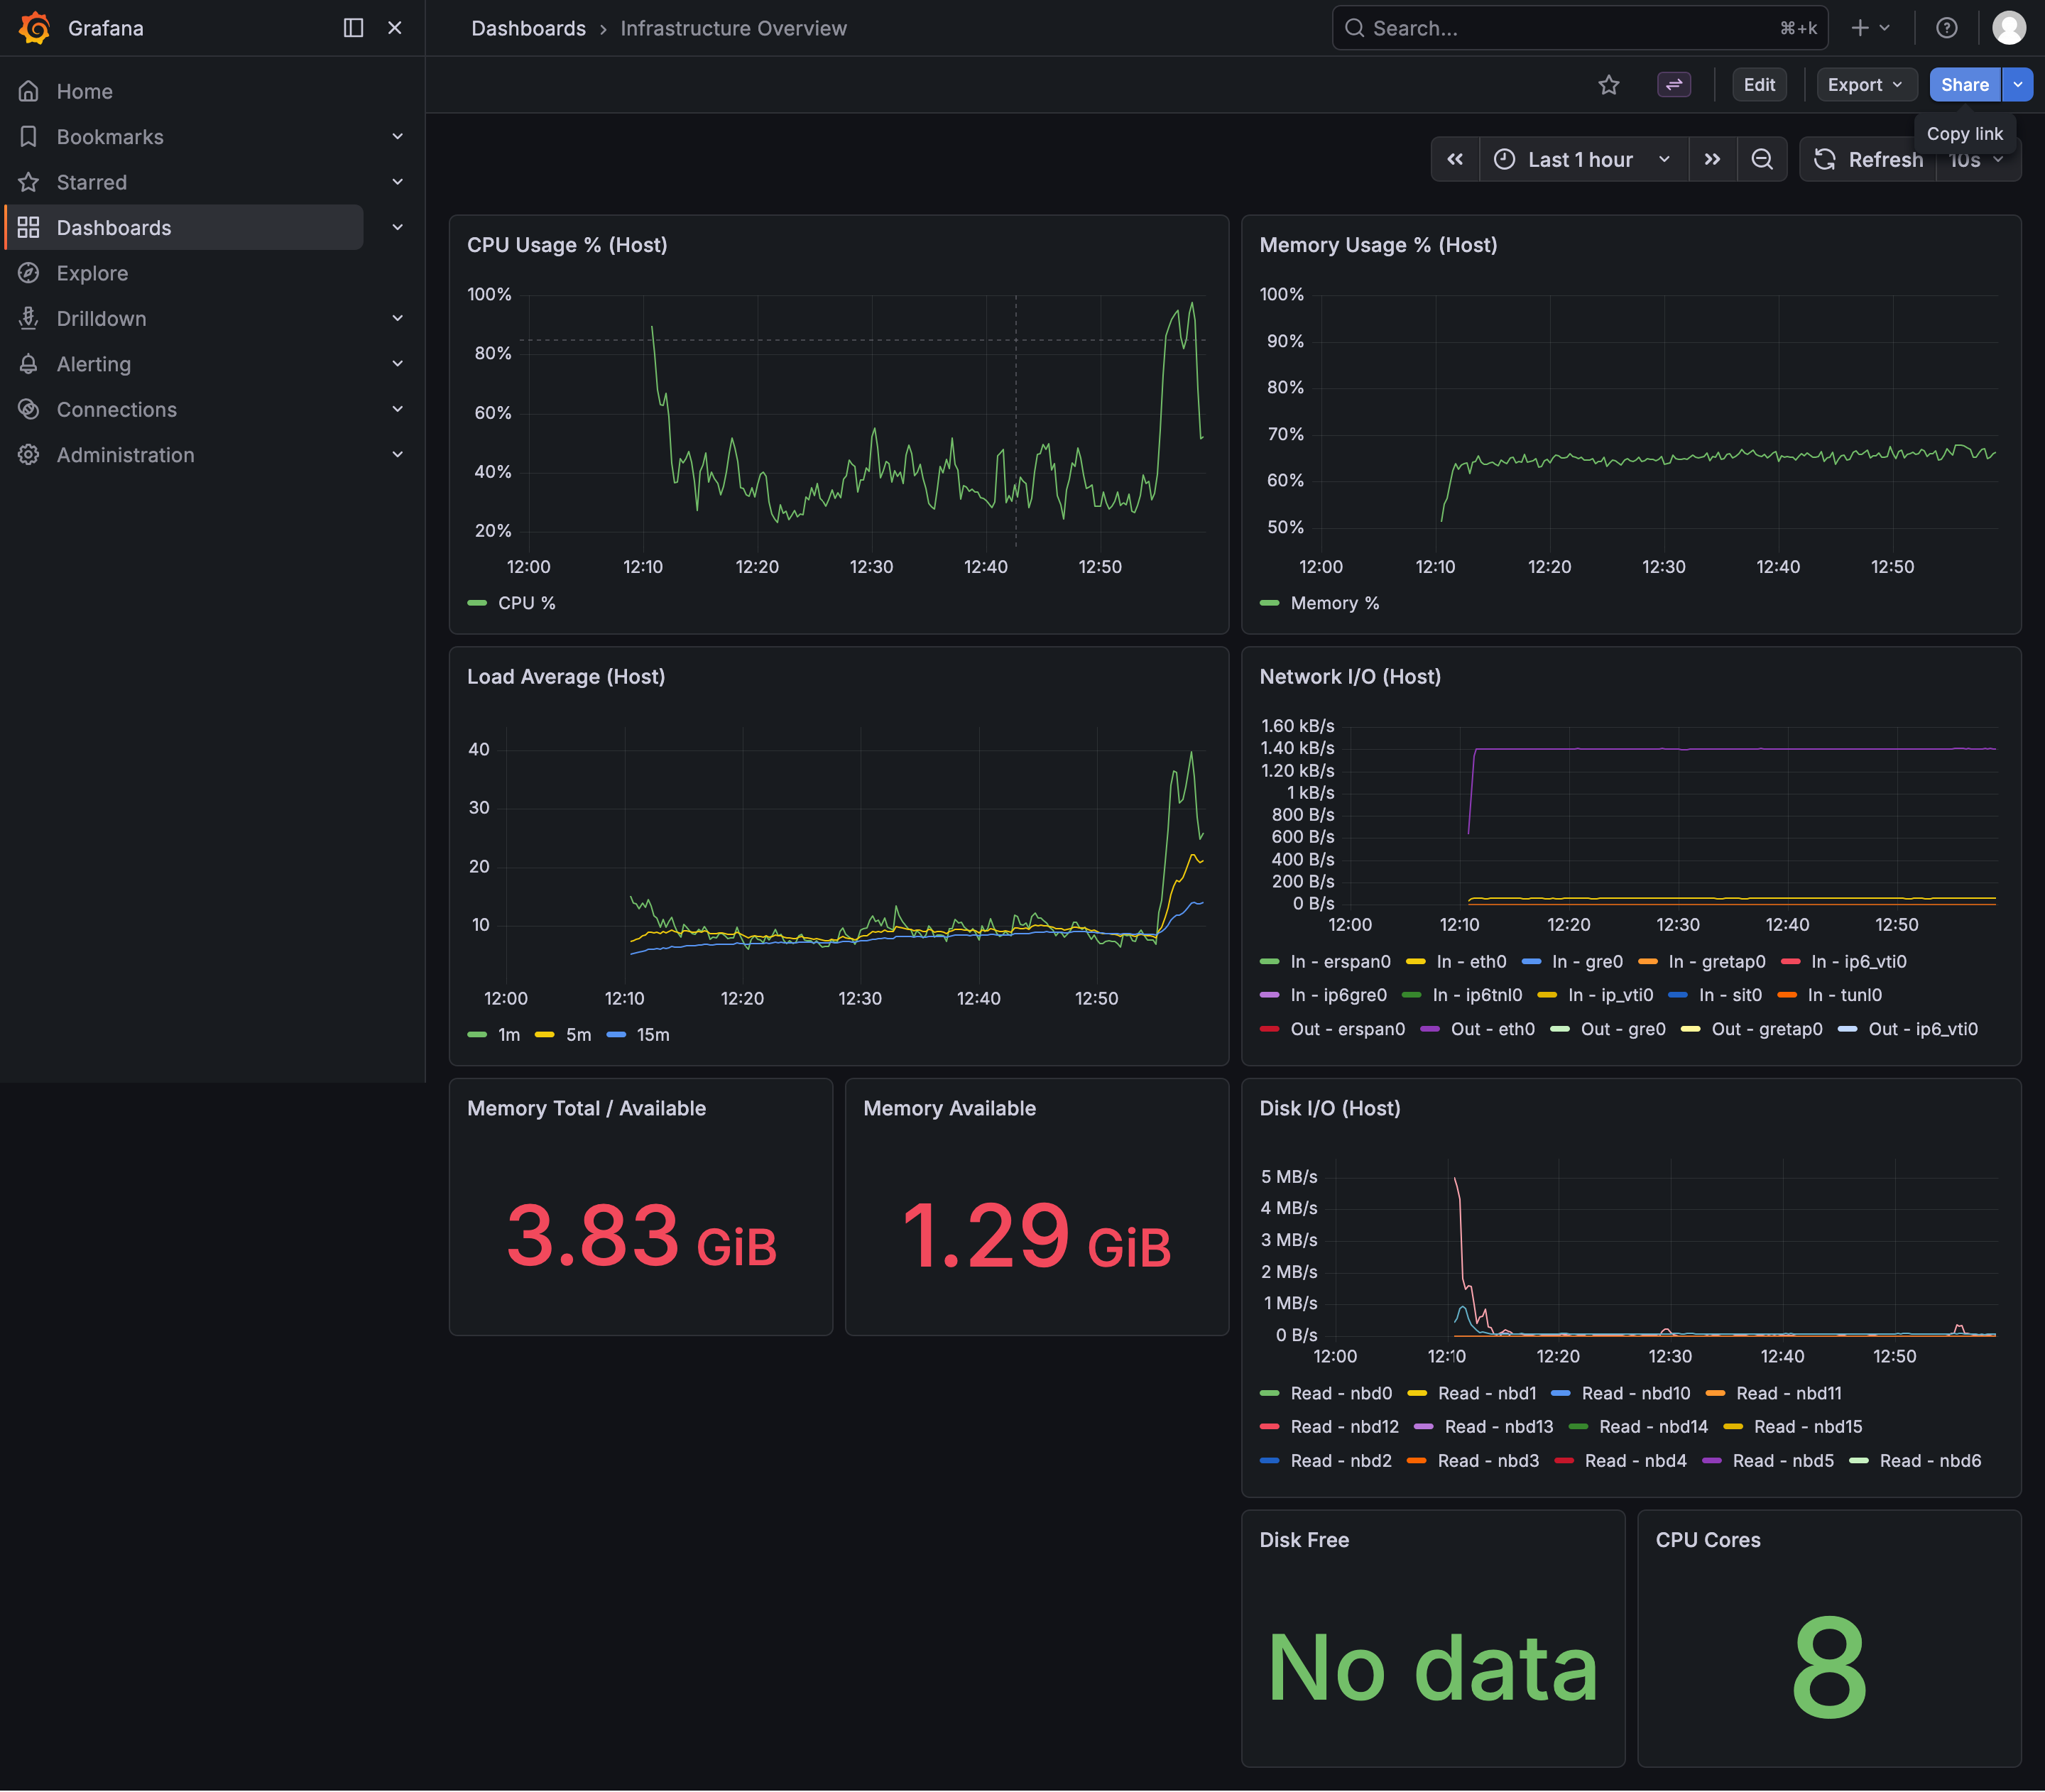
Infrastructure Dashboard - CPU, memory, and disk usage
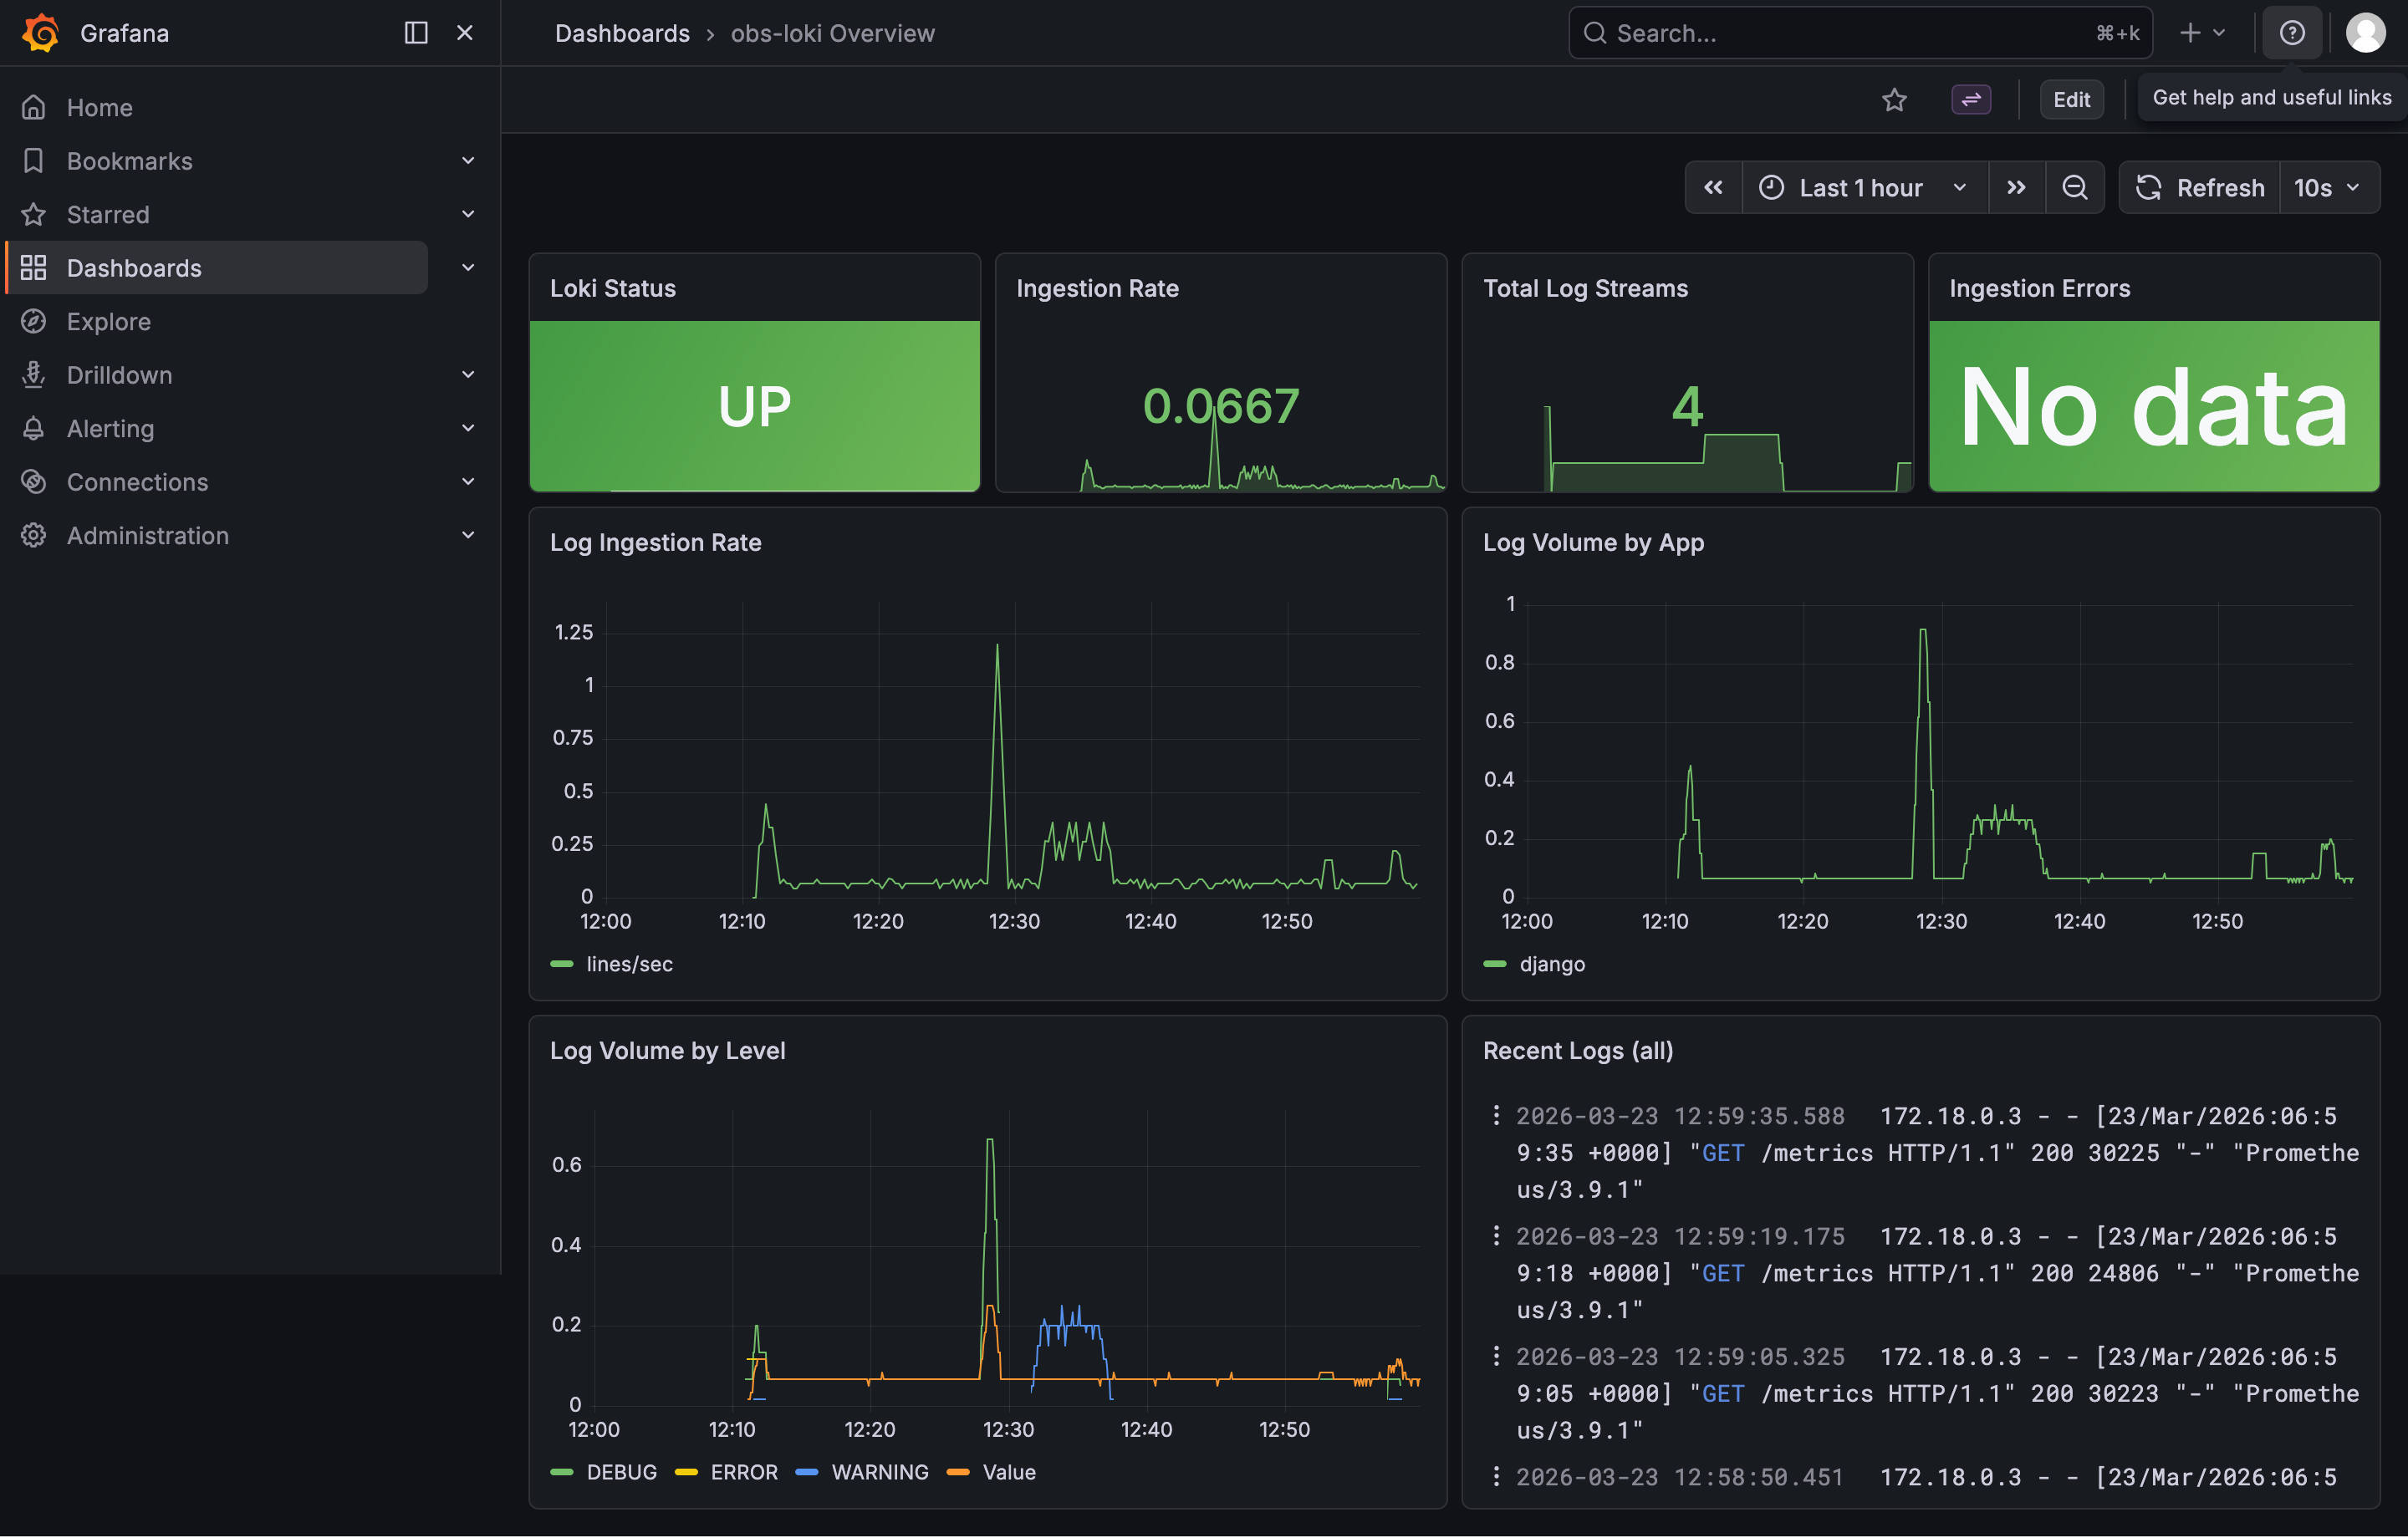
Loki Dashboard - Log aggregation and search
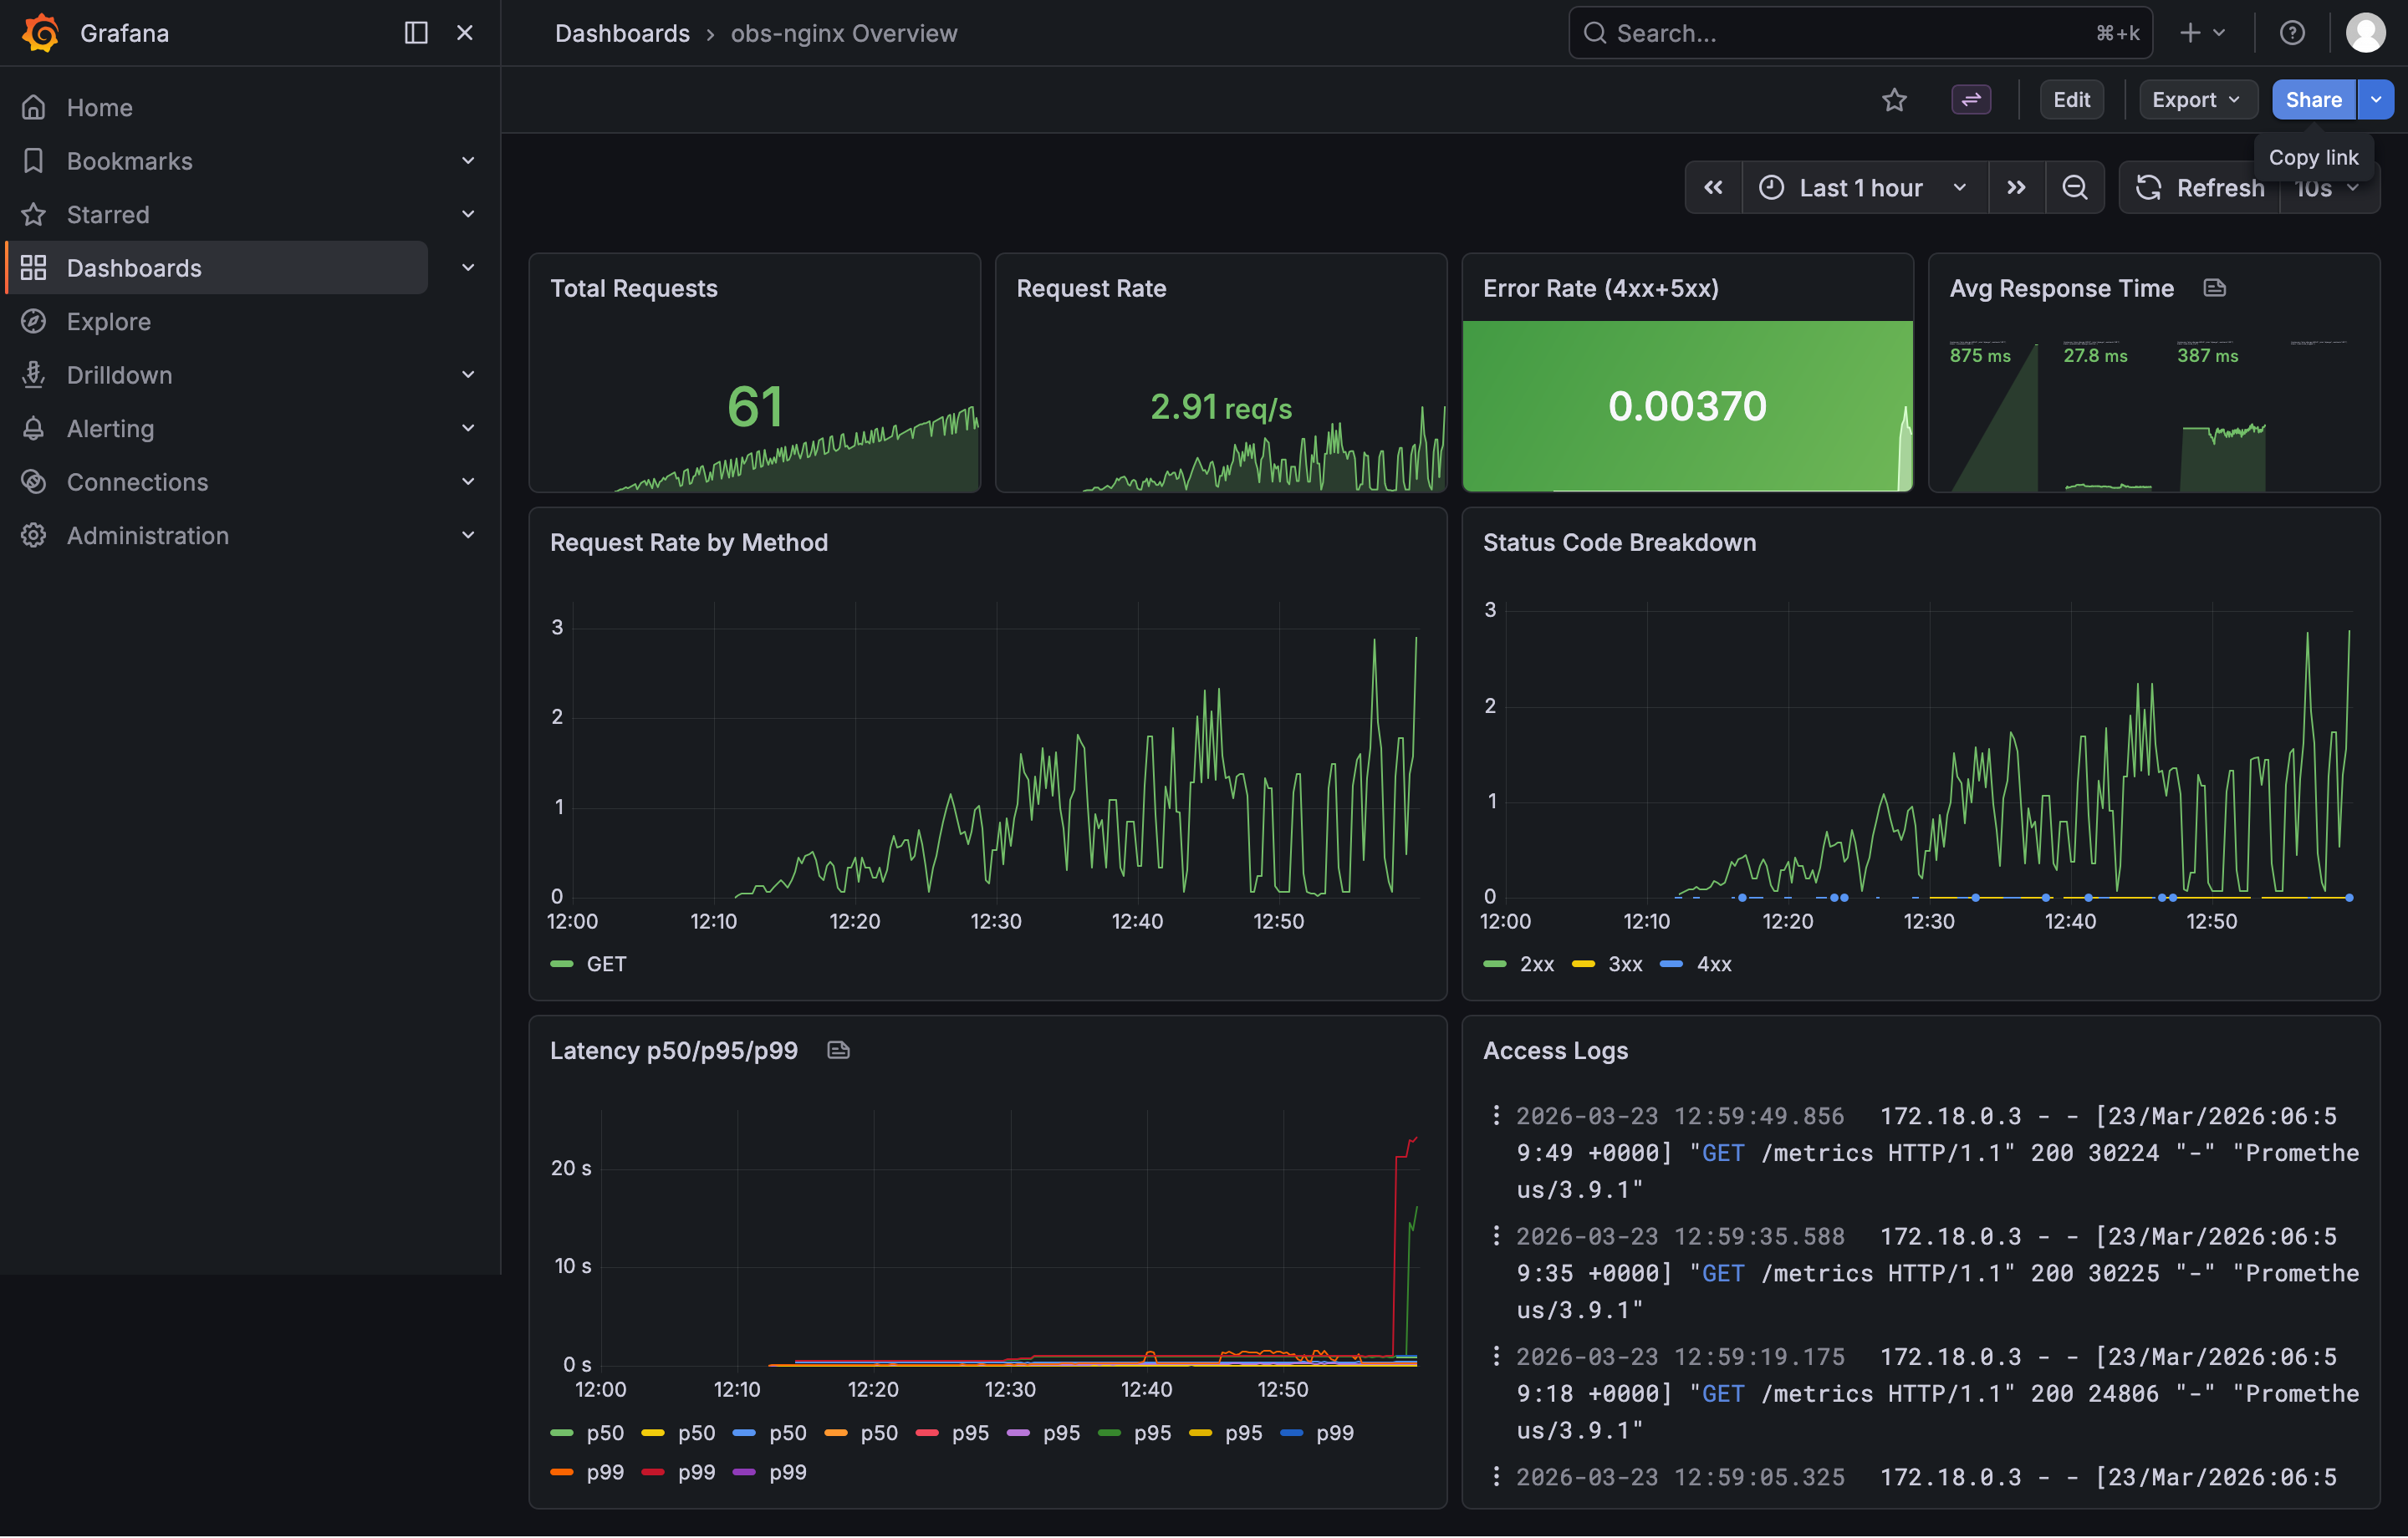
Nginx Dashboard - Reverse proxy metrics
📝 Application
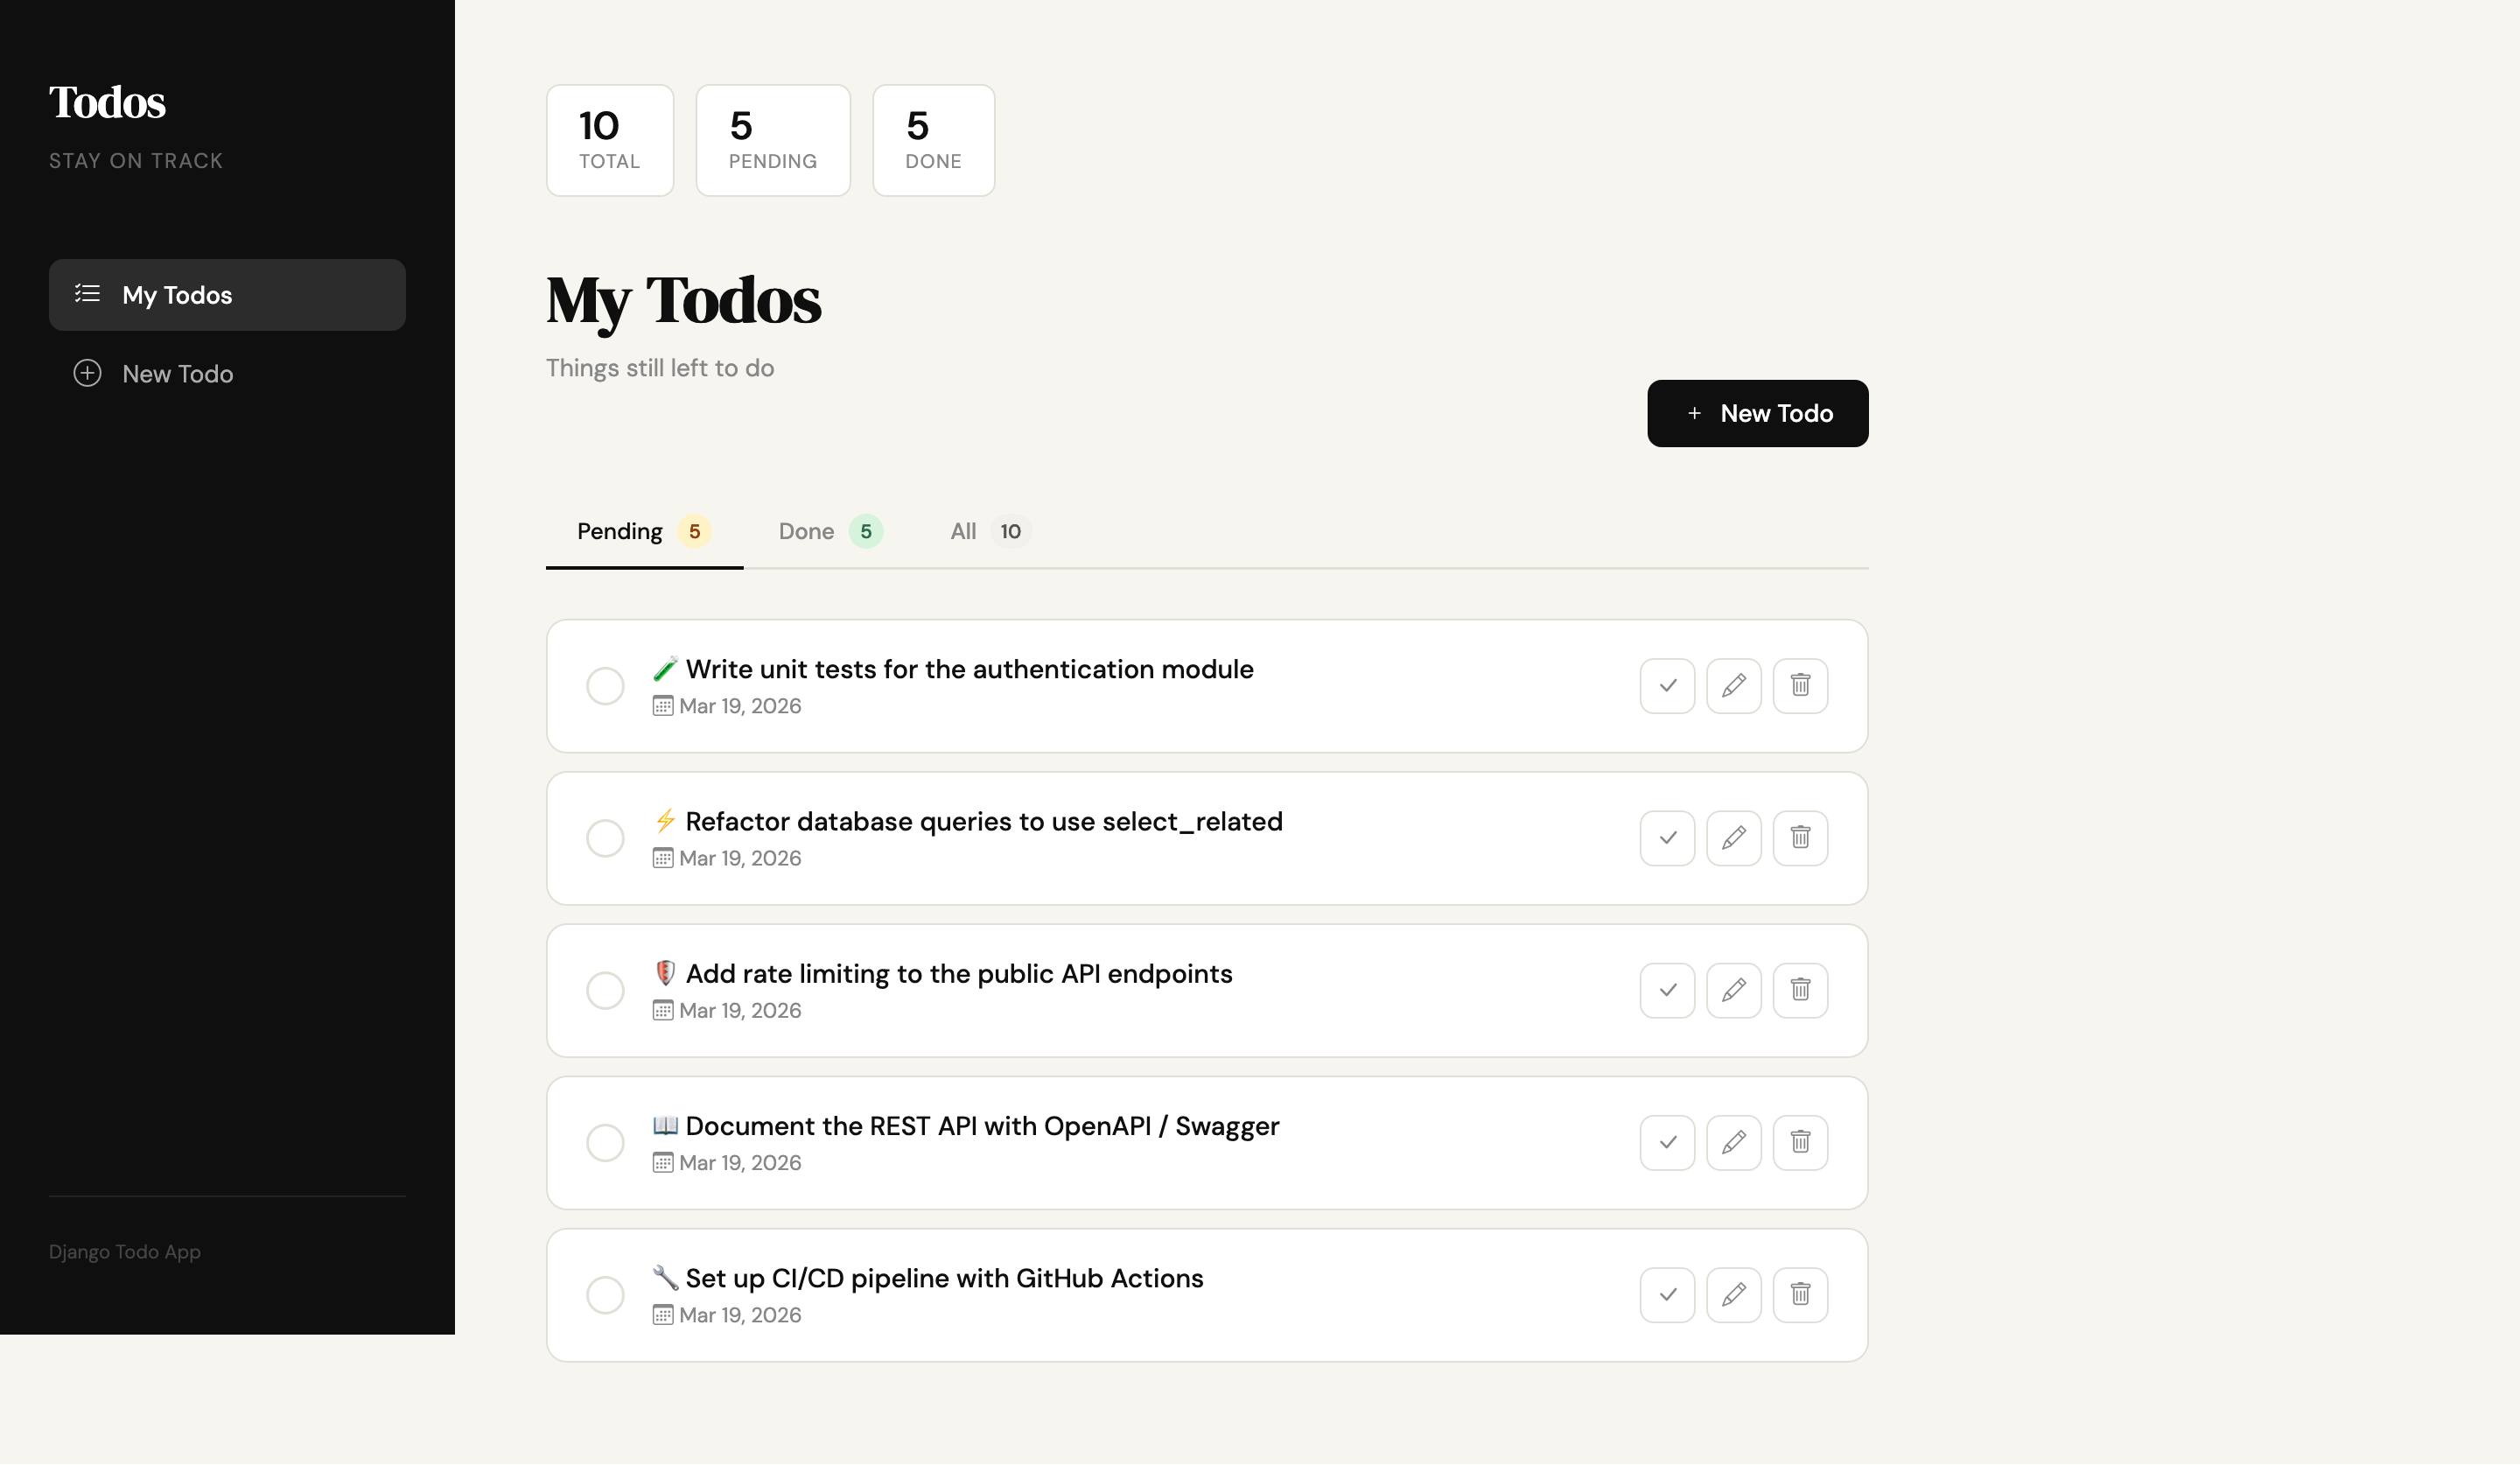
Todo Application - Django app being monitored
🤖 MCP Server
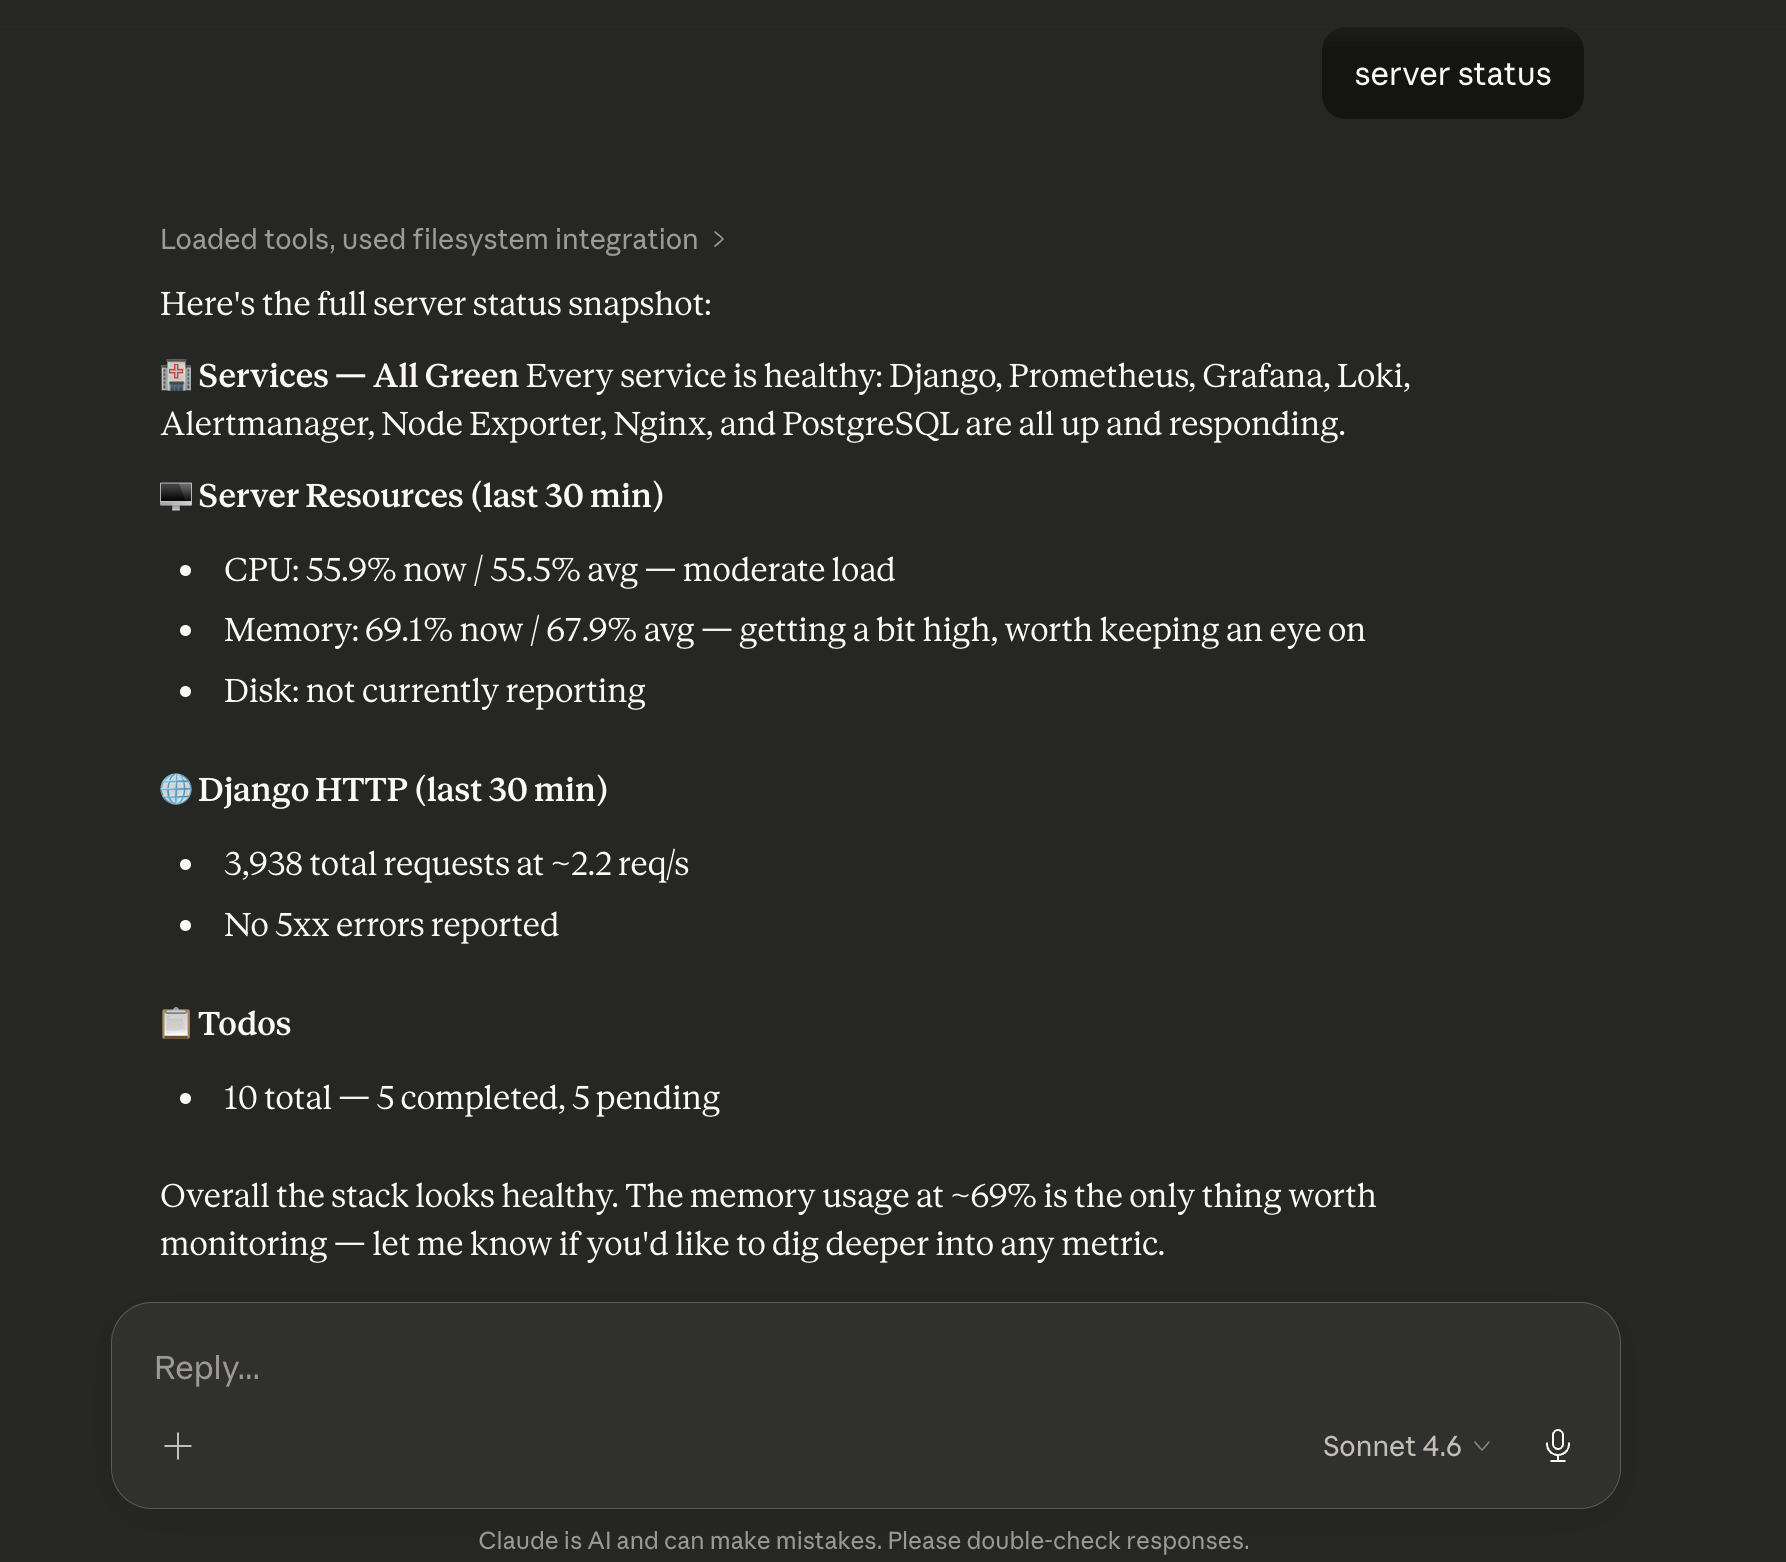
MCP Server - Health check and service status
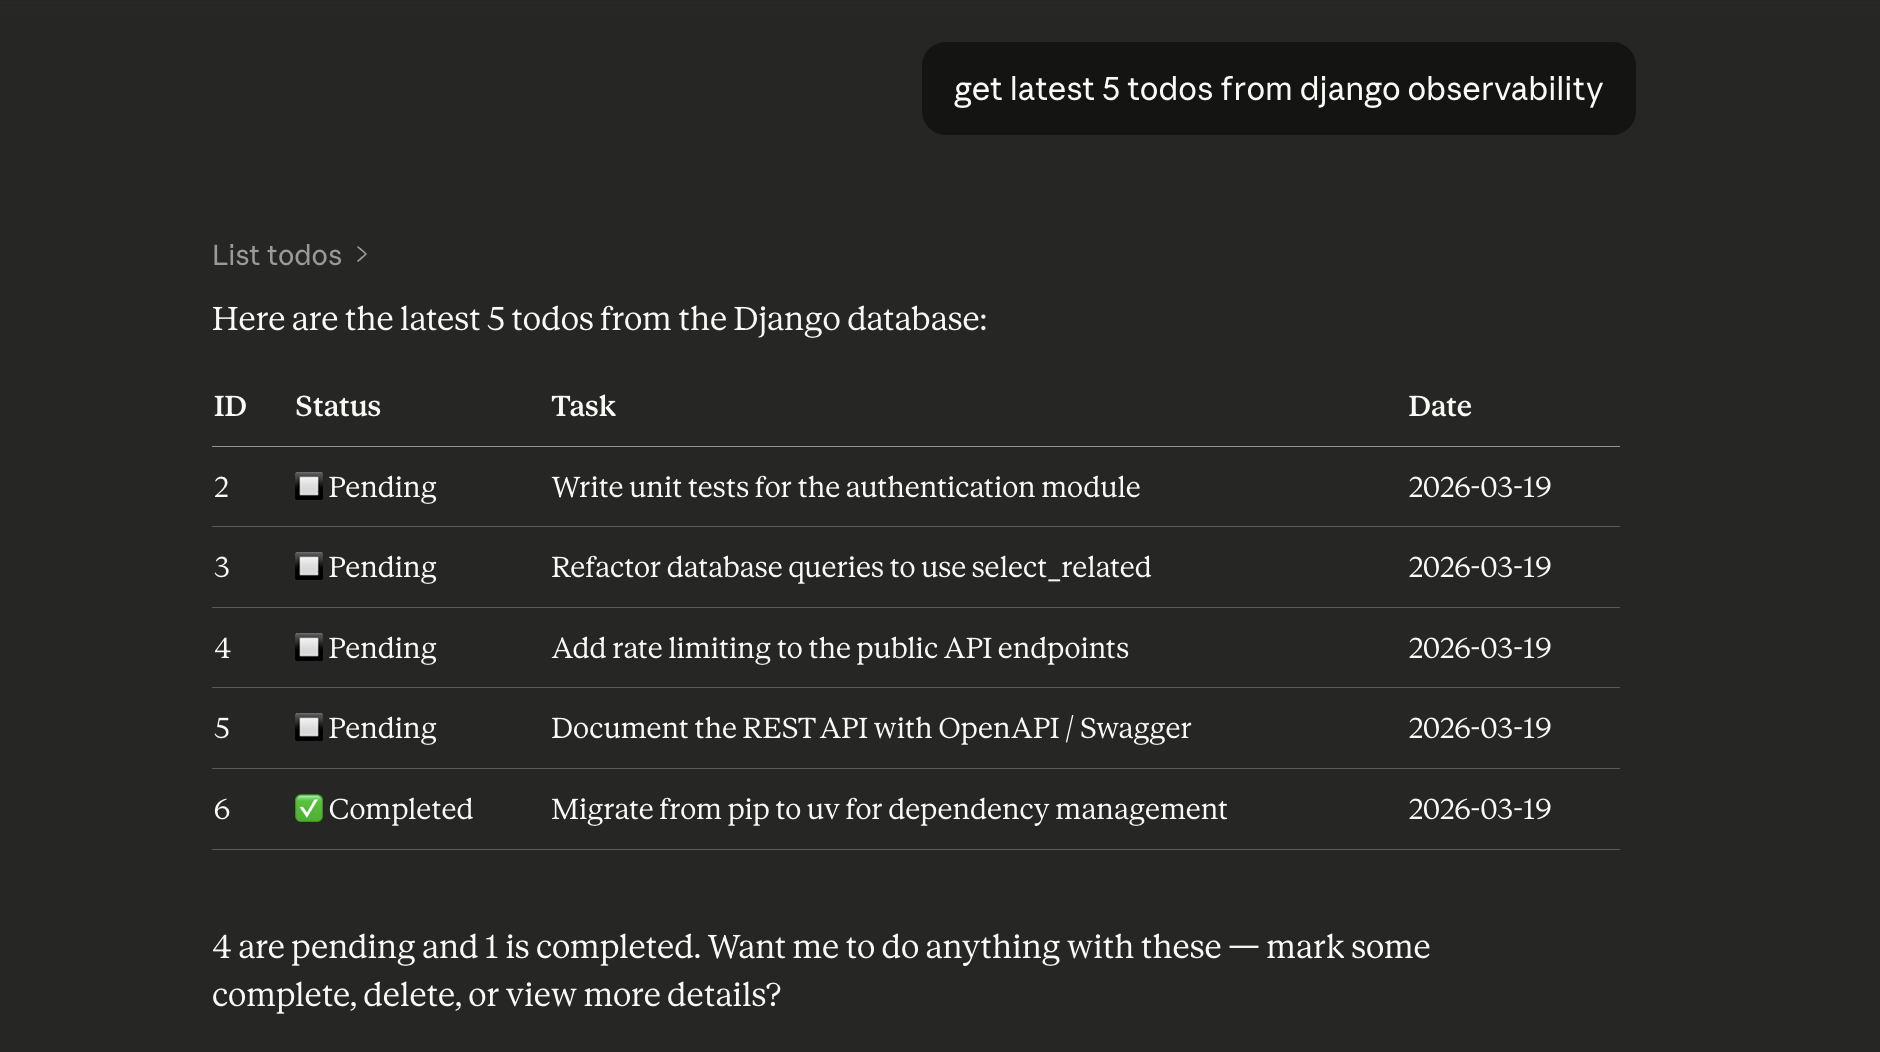
MCP Tool - Fetching latest todos via MCP server
📈 Prometheus
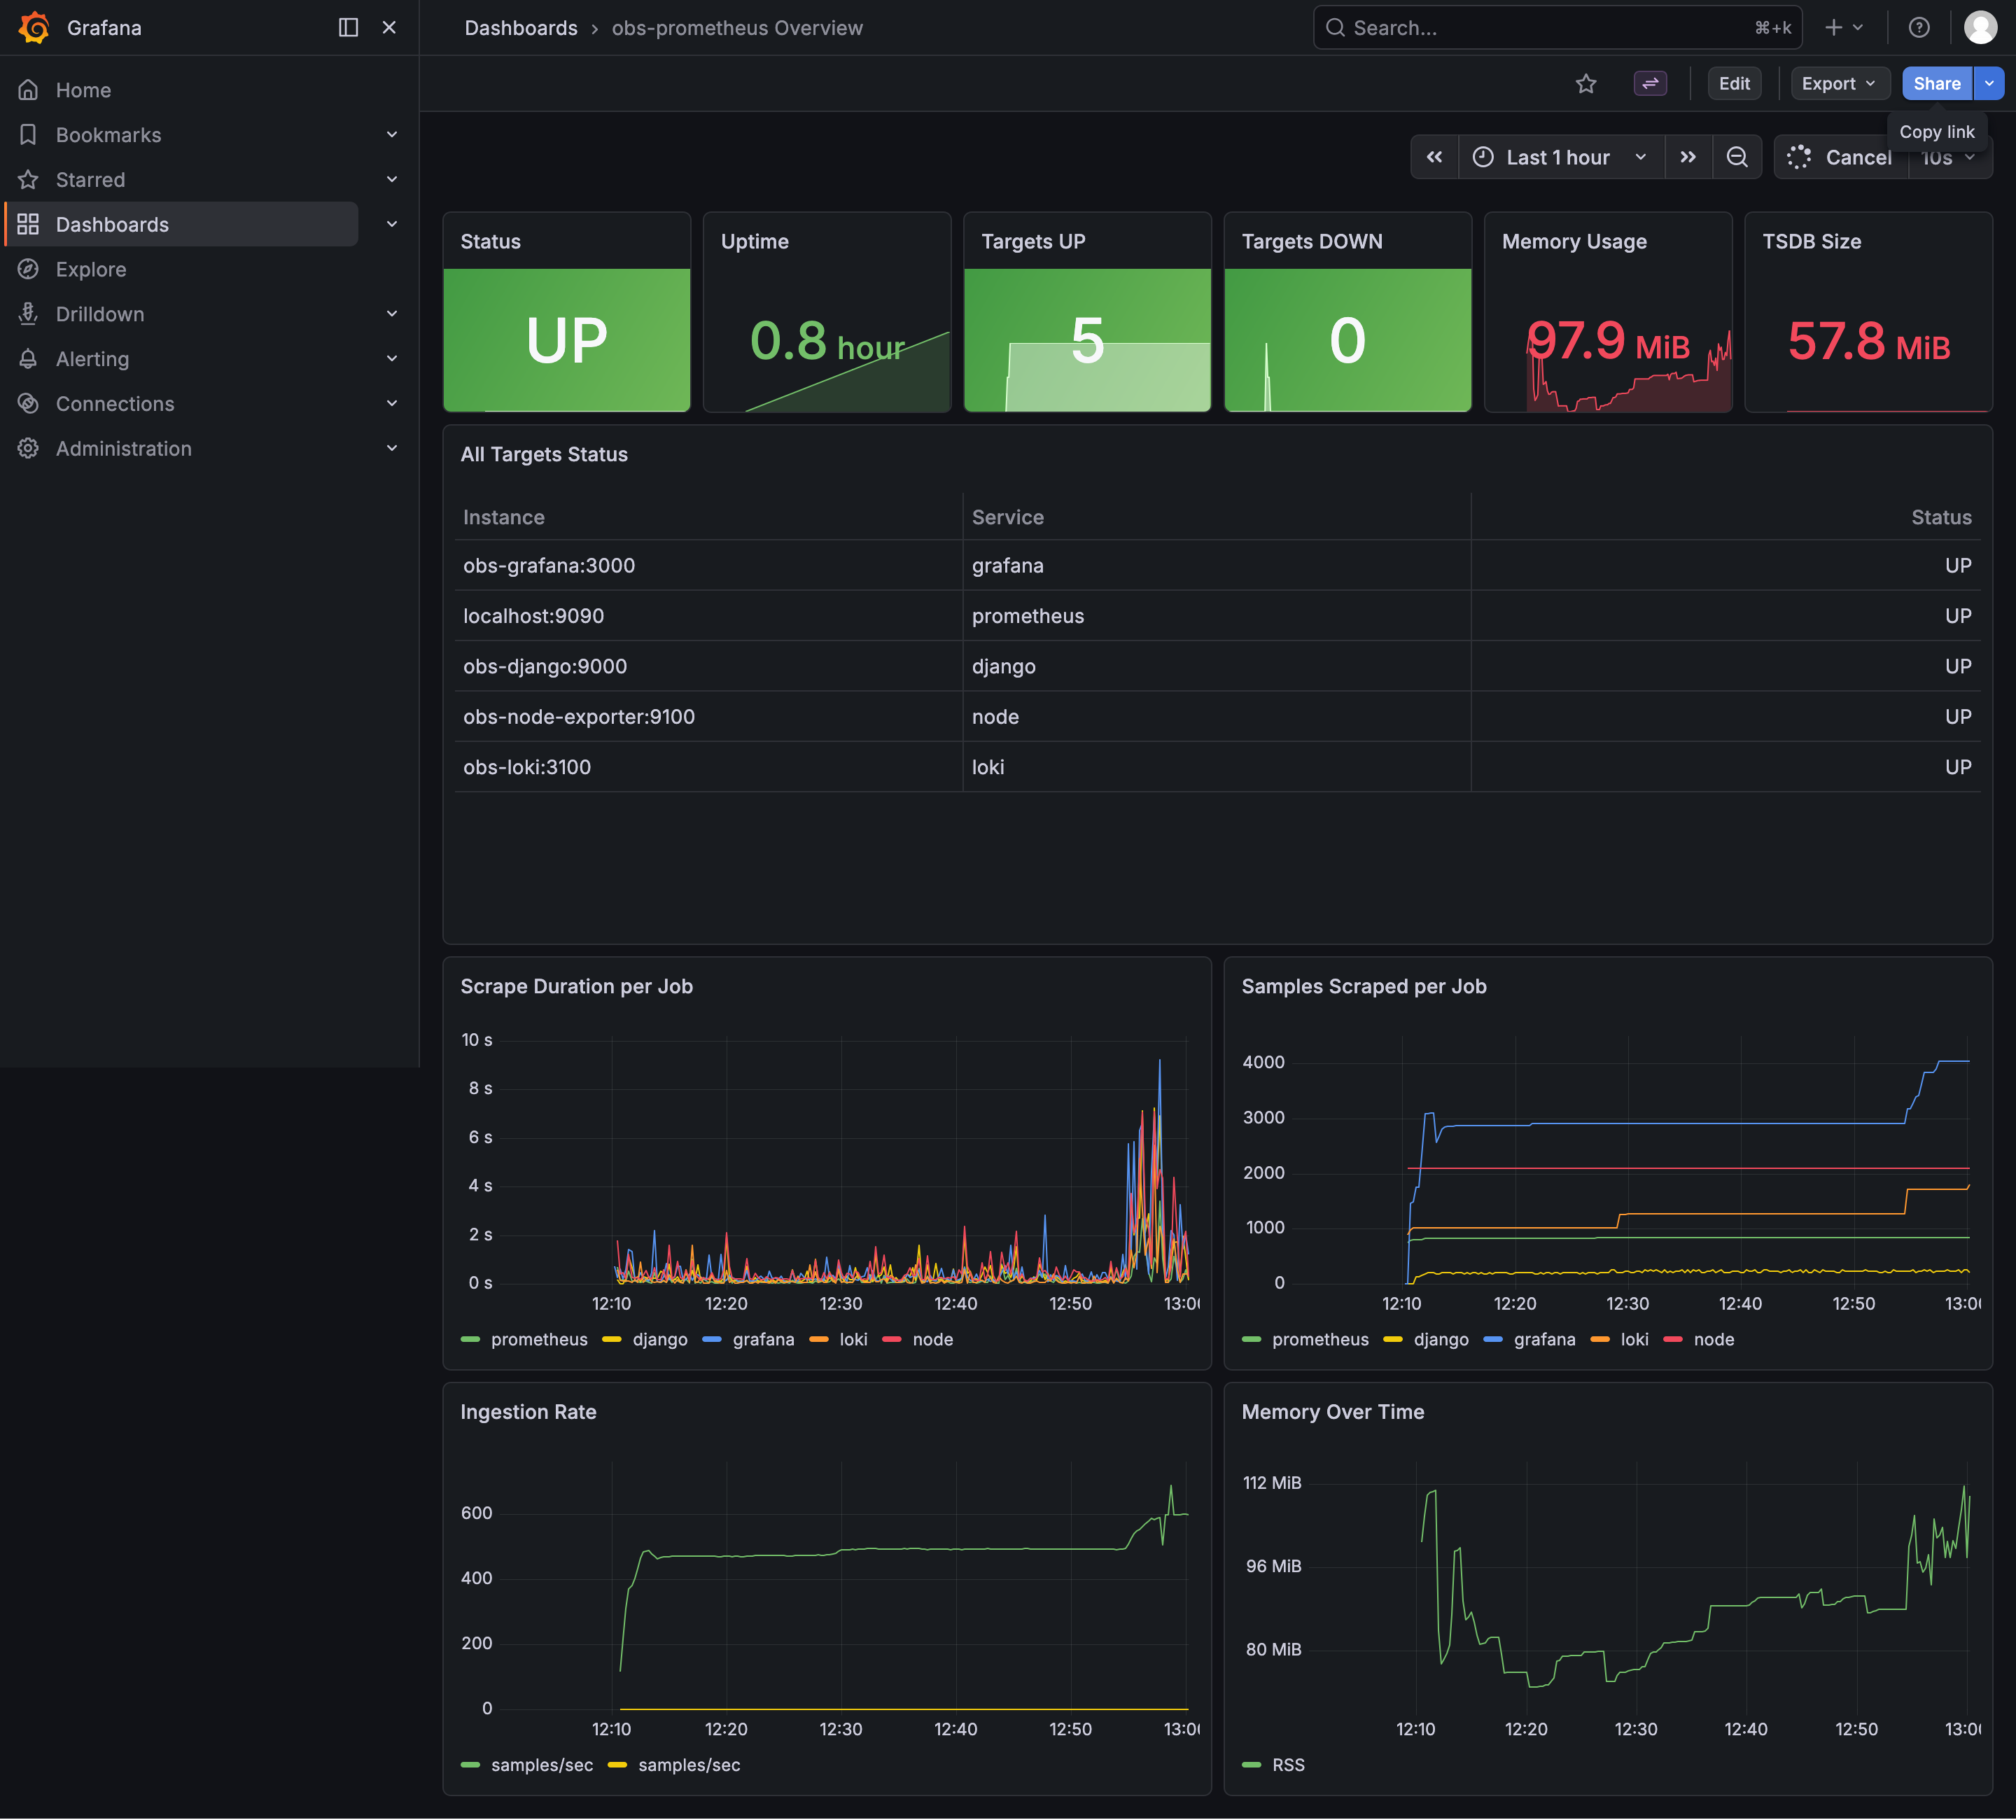
Prometheus UI - Main metrics dashboard
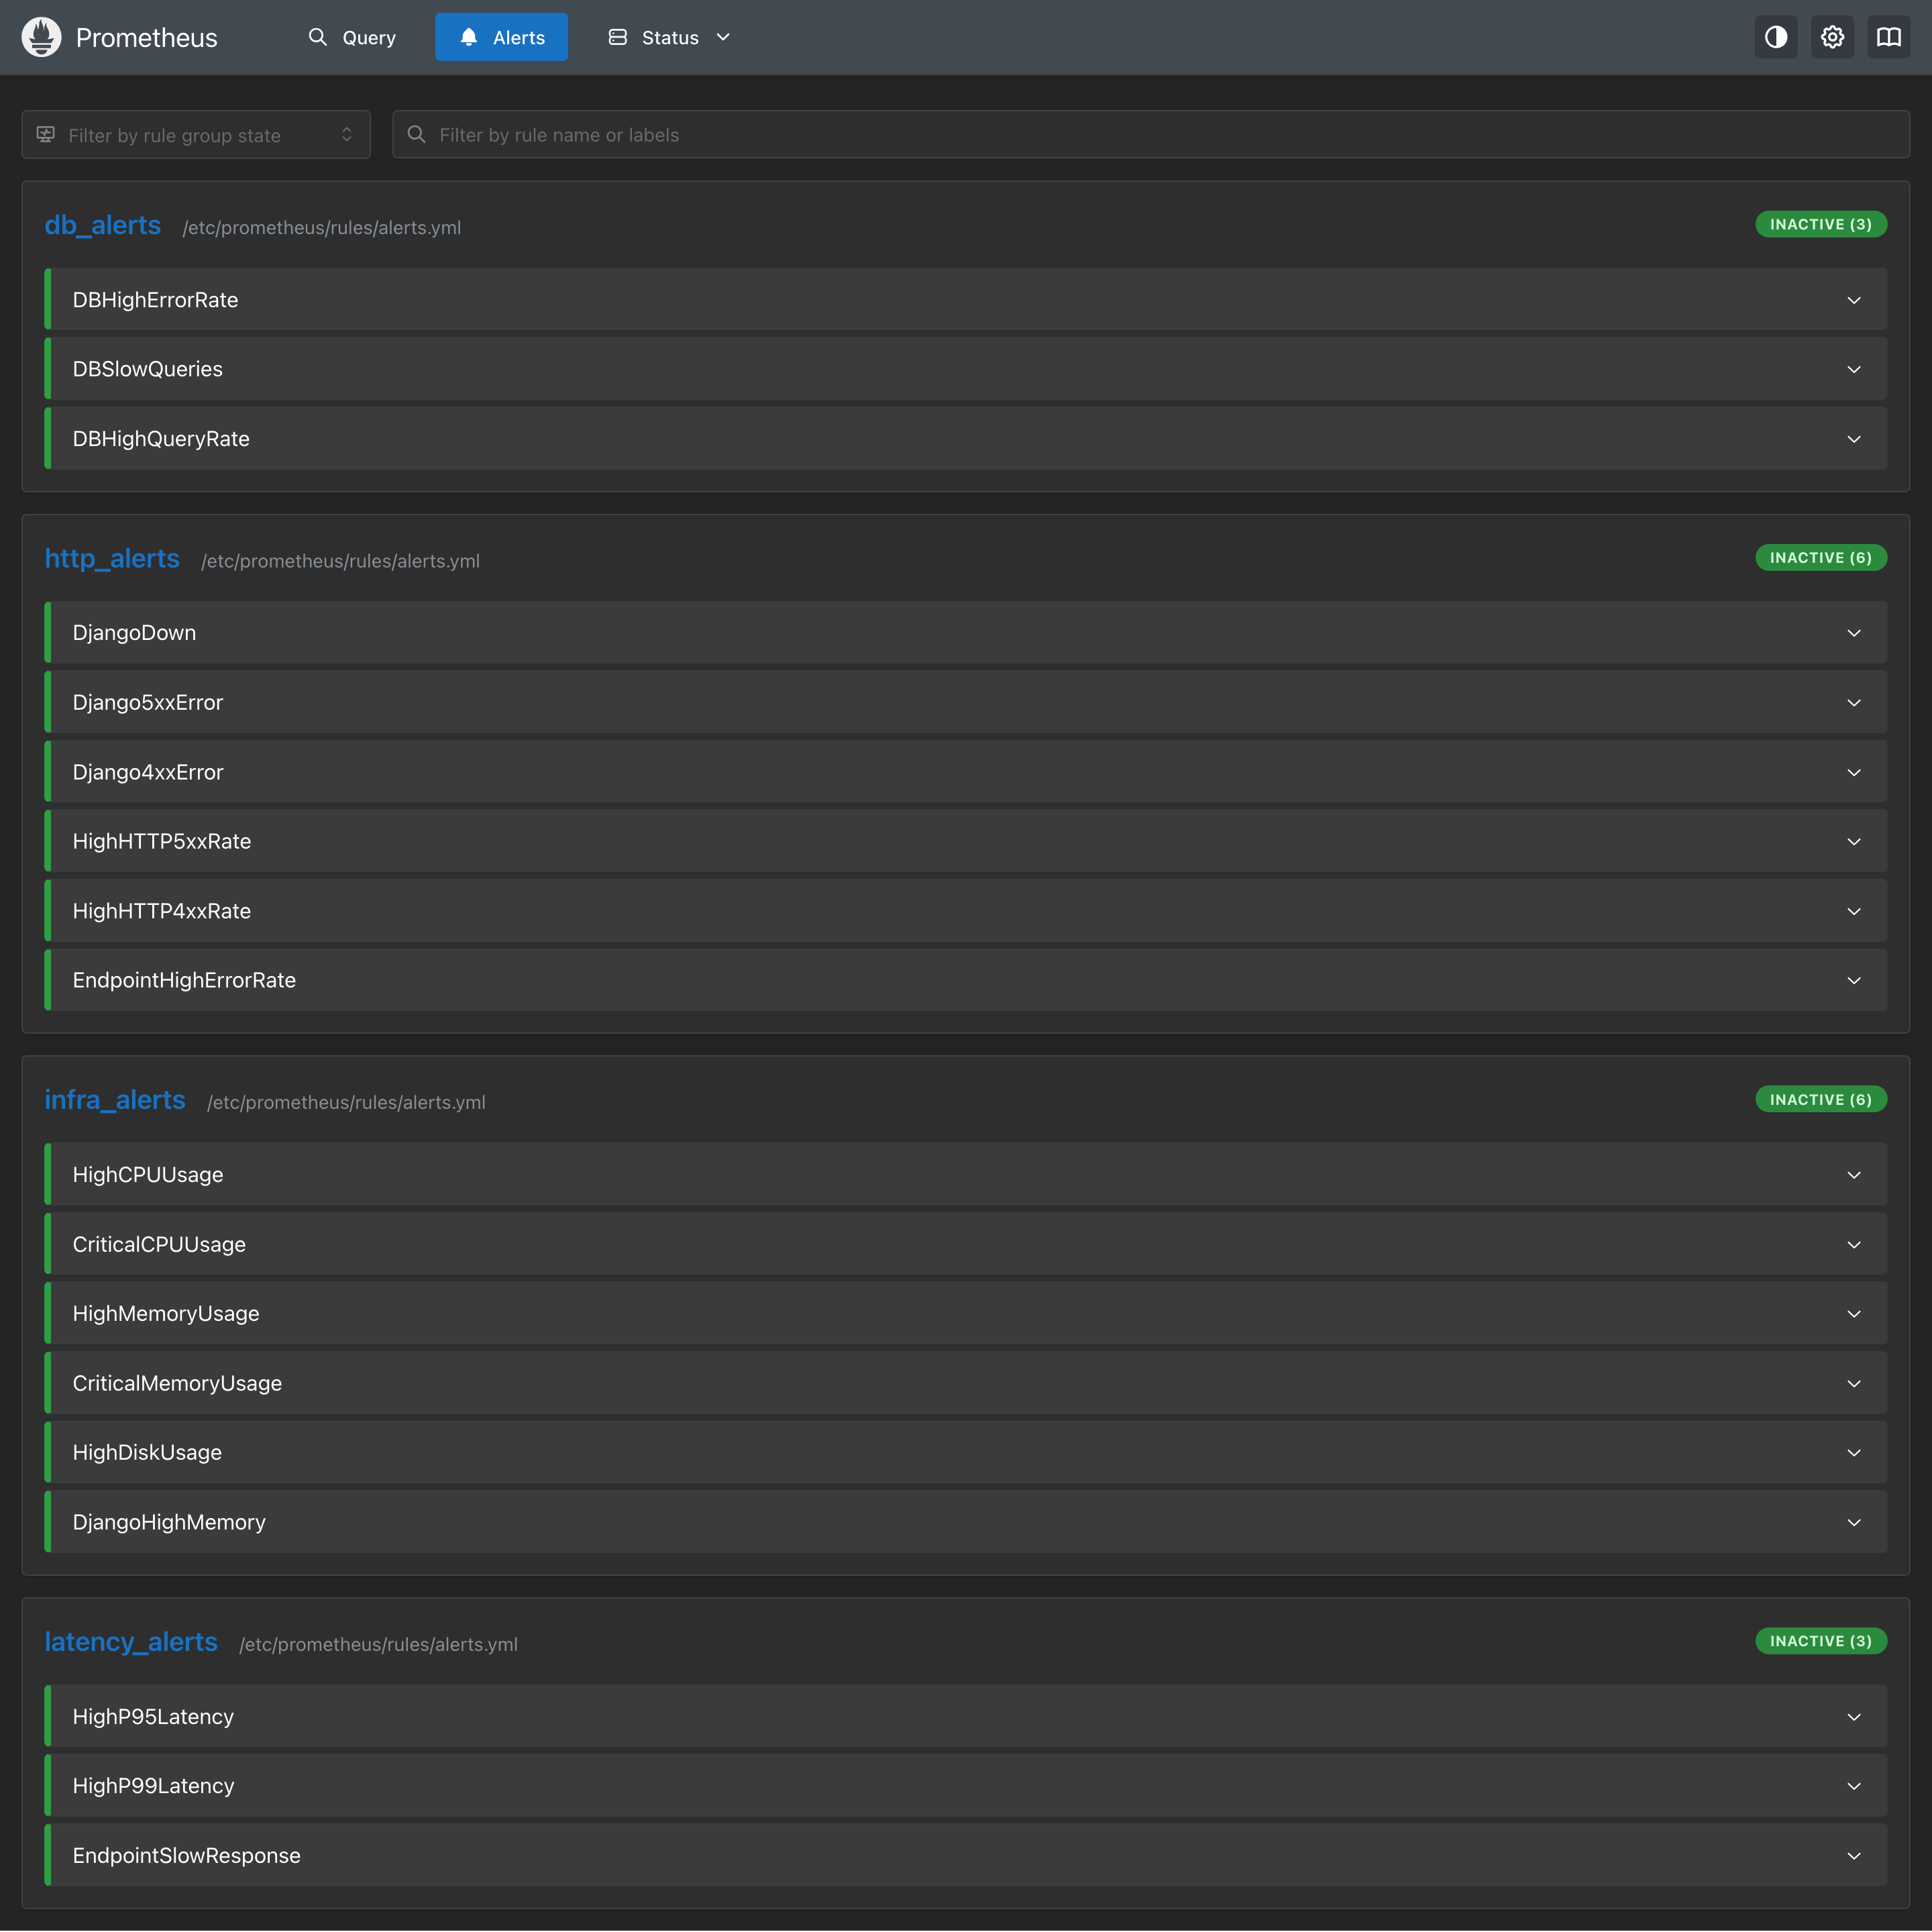
Alert Rules - Configured alert rules in Prometheus
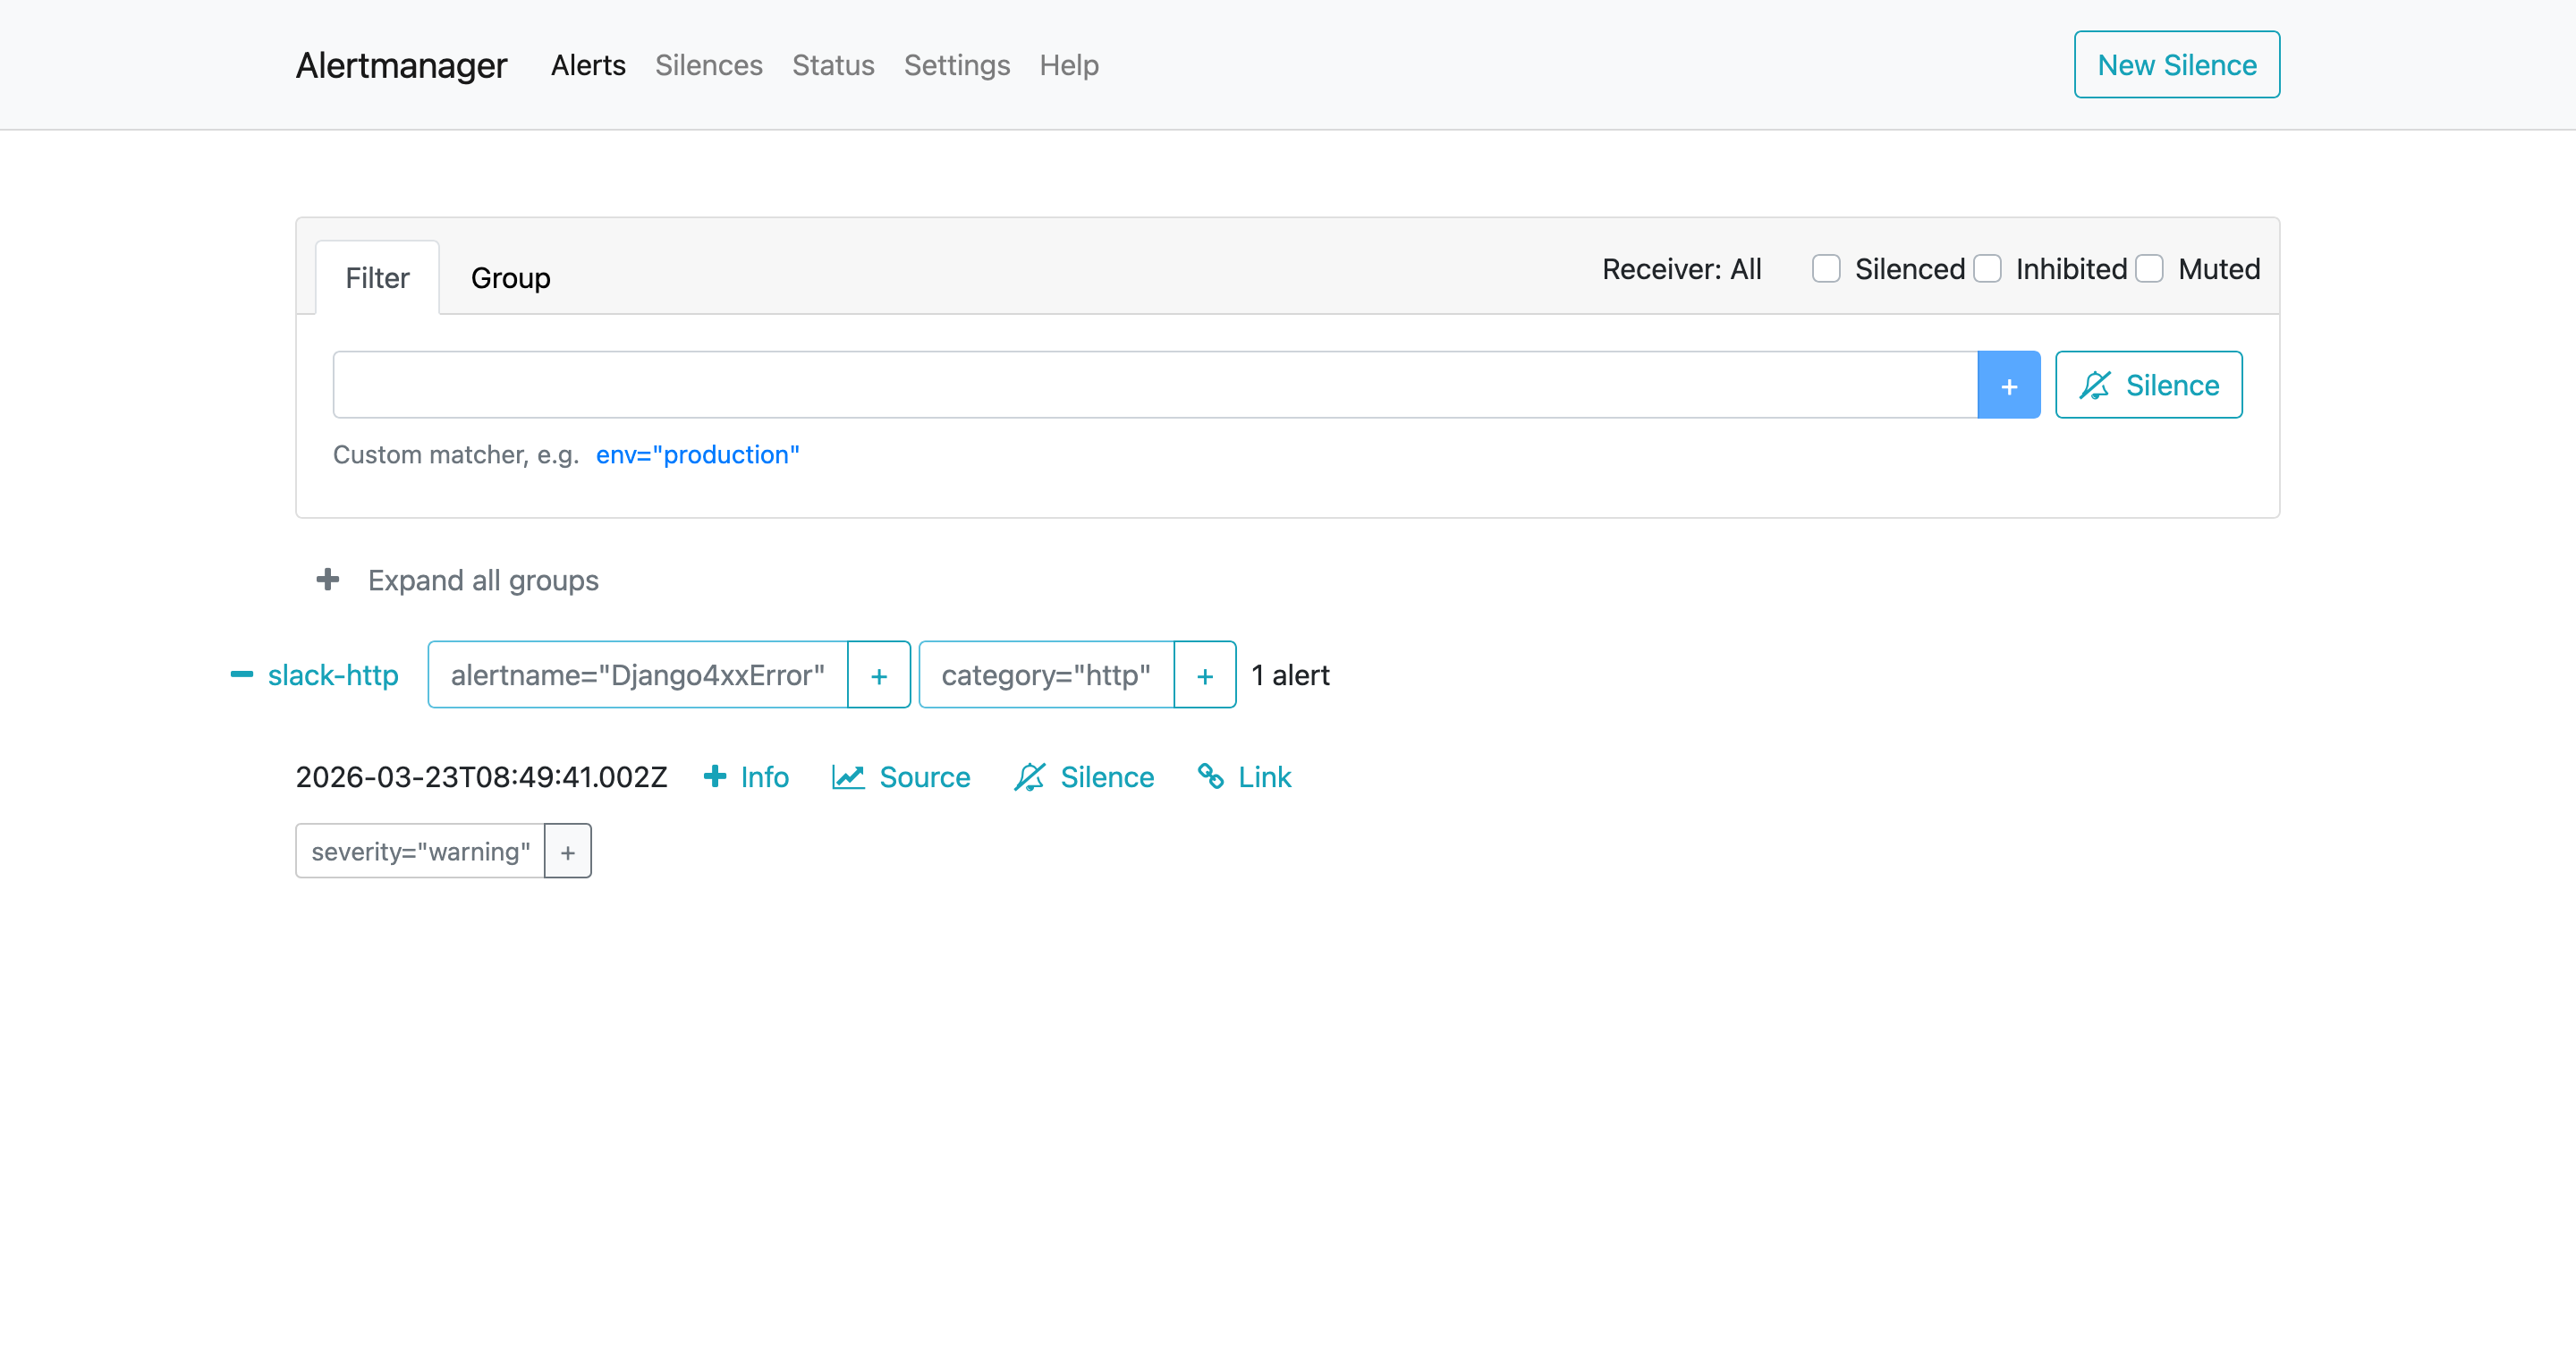
Alertmanager UI - Alert routing and notifications
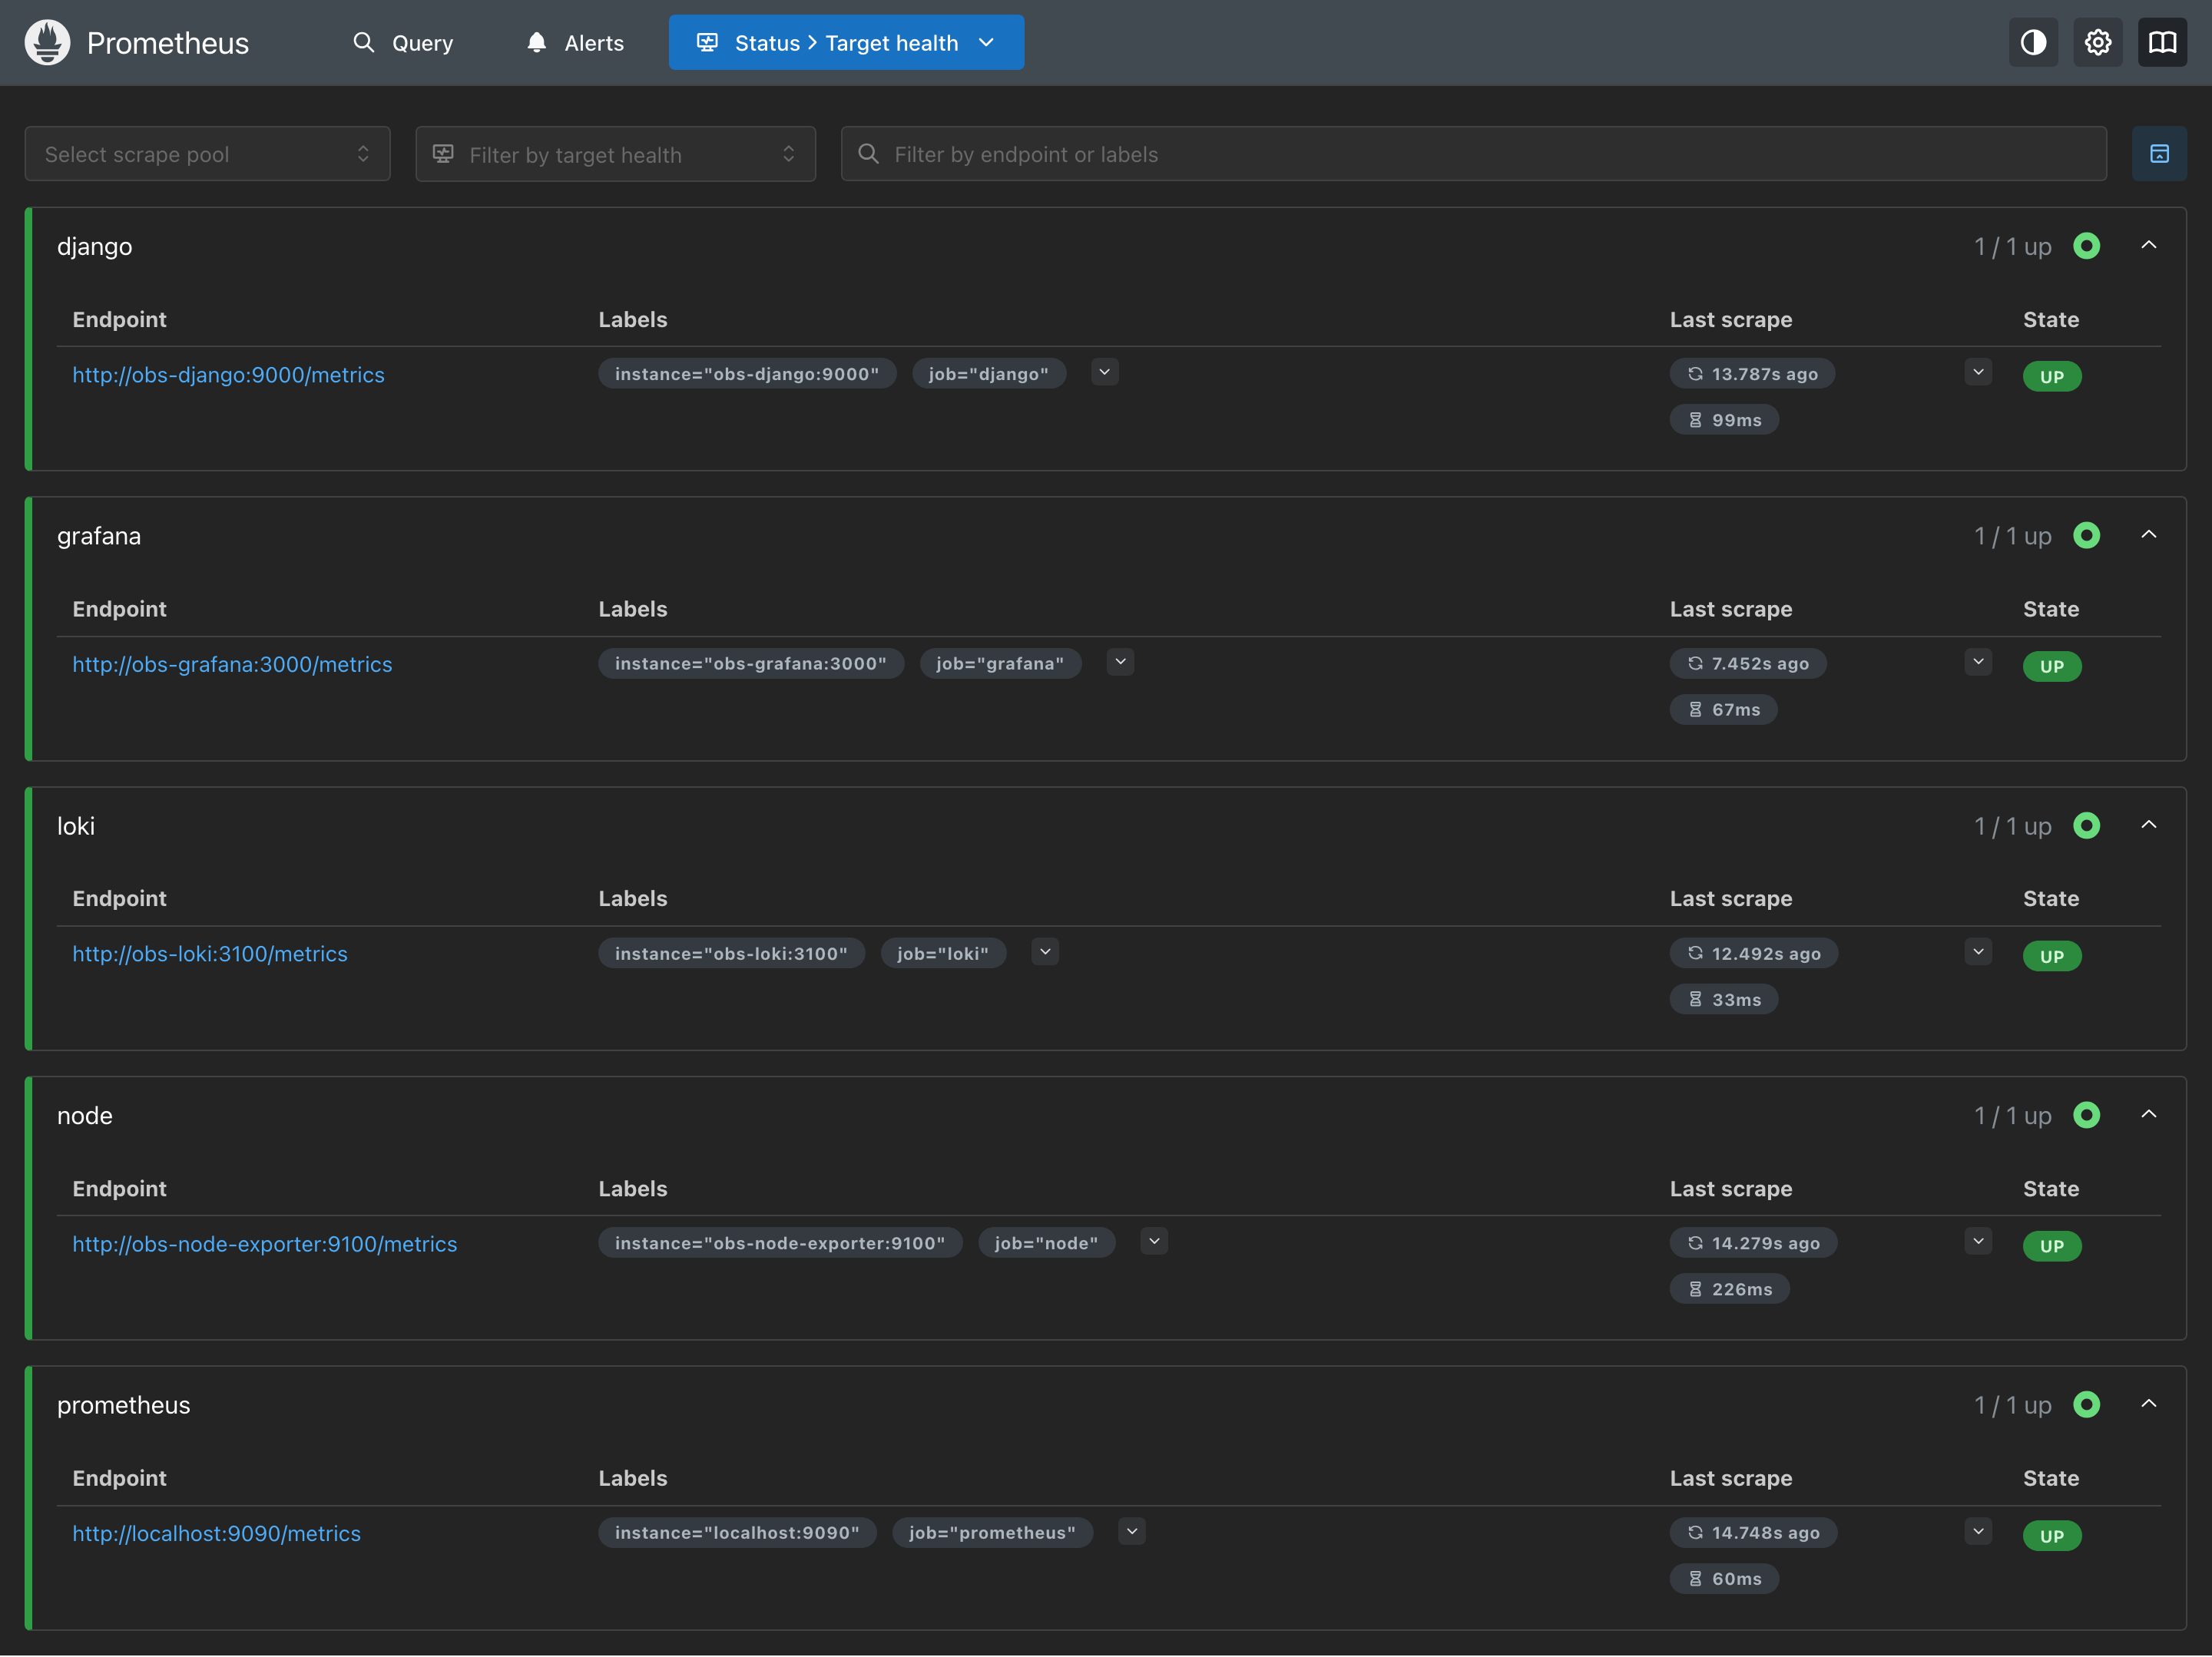
Health Status - Target health monitoring
🎨 What You'll See
When you run the stack, you'll have access to:
| Feature | What It Shows |
|---|---|
| Grafana Dashboards | Real-time metrics visualization |
| Prometheus UI | Raw metrics and PromQL queries |
| Alertmanager | Alert status and routing |
| Loki/LogQL | Log search and analysis |
| MCP Server | AI-powered insights |
📱 Taking Your Own Screenshots
Want to capture your own screenshots? Here's how:
Grafana
- Open http://localhost:3000
- Login with admin/admin
- Navigate to Dashboards
- Press
Cmd+Shift+4(Mac) orWin+Shift+S(Windows)
Prometheus
- Open http://localhost:9090
- Go to Status → Targets
- Take screenshot of target health
Application
- Open http://localhost
- Create some todos
- Take screenshot of the app
Ready to explore? 👇